The Design Process
John Collier and Rosemarie Foley
Contents
Understand
Since our project needed to be informed by SDG 14 and nobody in the team had relevant knowledge on target 14.1 “Reduce Marine Pollution”, we decided to do a PESTEL analysis. We chose this framework to help us gain a deeper understanding of the many different factors that could impact our project. We believed that in order to discern the magnitude and complexity of this broad topic, we first needed to examine Ireland’s current performance in terms of ocean plastic contamination before we could move into discerning the relationship between UCC and target 14.1.
Considering the broad and complex nature of the topic at hand, we established a series of basic aspects to guide our research, as represented in table 3.1:
PESTEL Analysis Guide
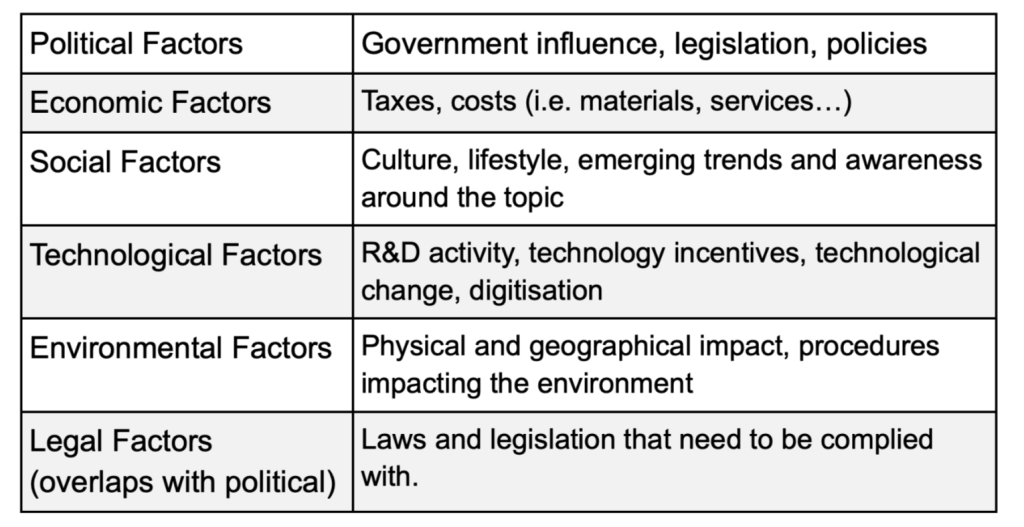
Table 3.1: Typical factors used for the Pestel Analysis (Aguilar, 1977)
After finding a substantial amount of resources, we summarised our findings in the table below:
PESTEL Analysis
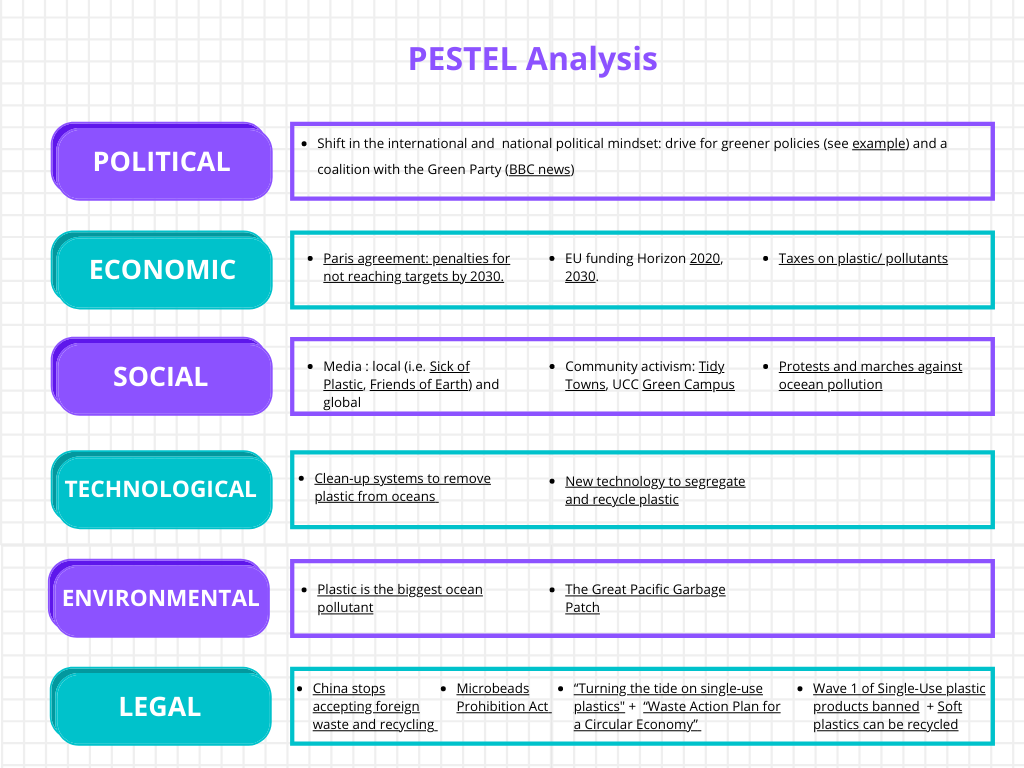
Figure 1: PESTEL Analysis of the Plastic industry and its effect on the environment.
Having these insights provided us with a solid foundation to progress our research to find the ties between UCC and target 14.1. Considering that UCC was awarded the green flag back in 2010, we were not surprised to find out that it has earned a position among the top 10 universities worldwide, for its exceptional sustainable performance (Figure 2).
The World University Ranking
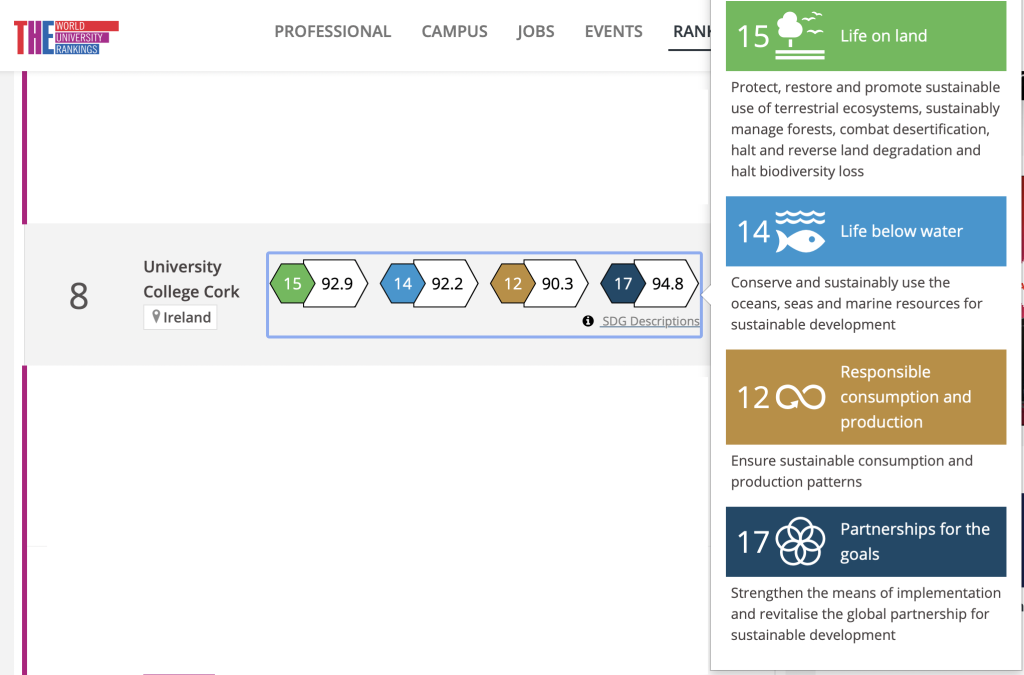
Figure 2: College rankings for their effect on various Sustainable Development Goals globally.
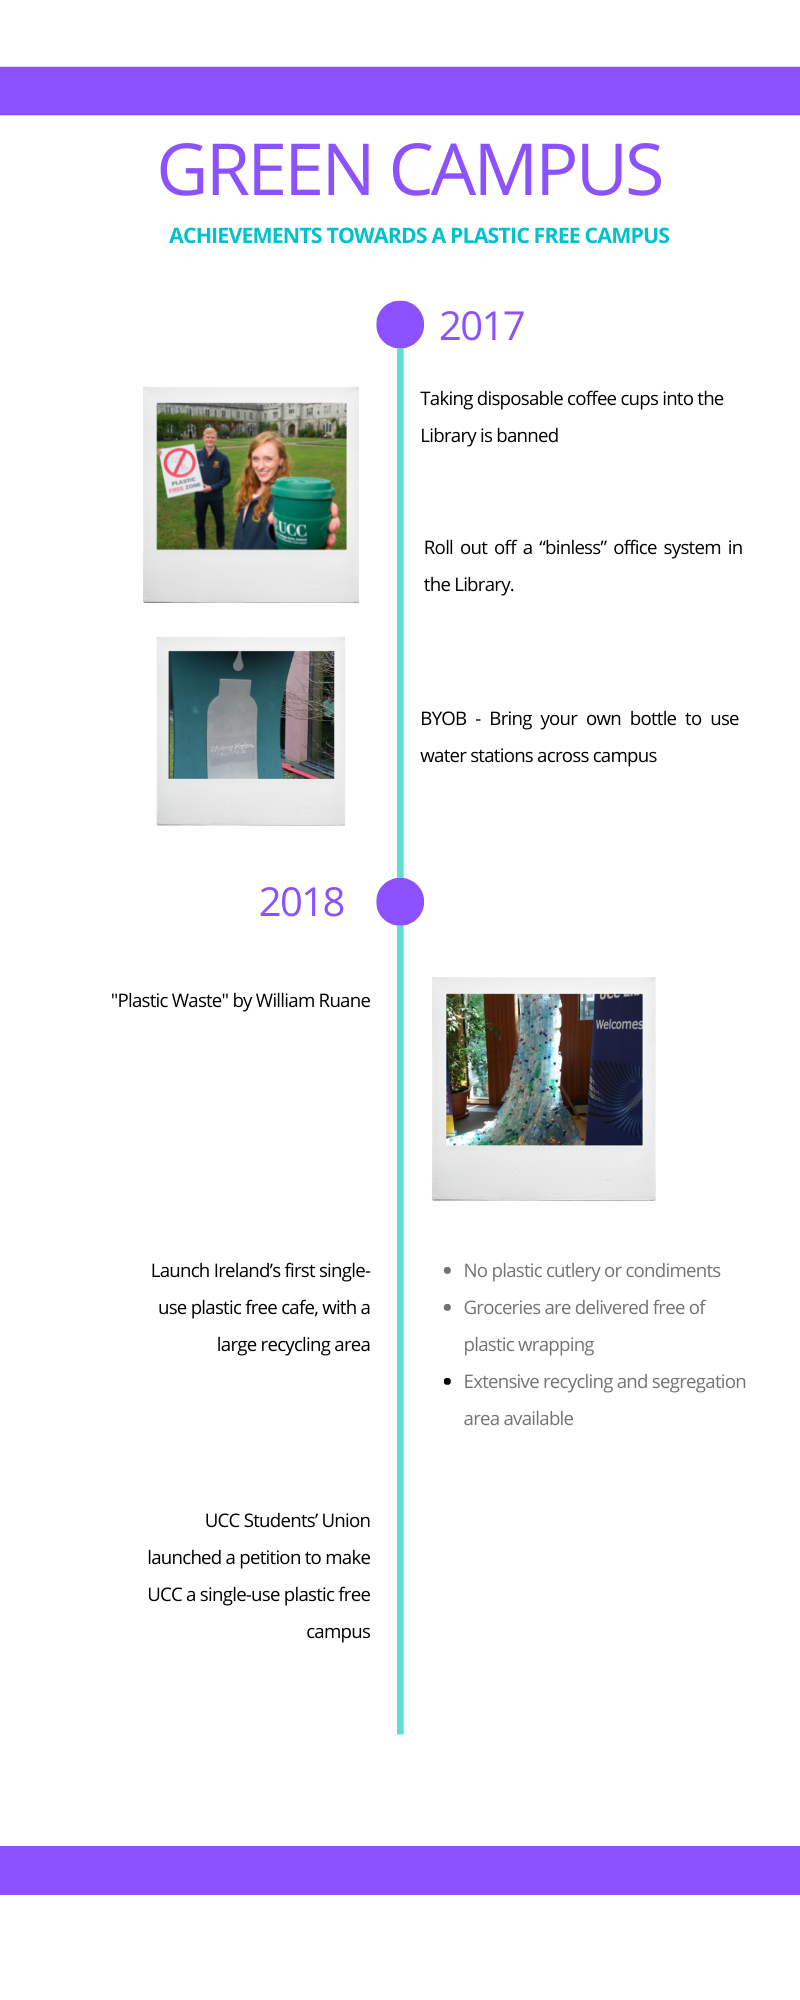
We narrowed down our investigation to find some of the initiatives and efforts that have helped UCC to be considered a reference in sustainable innovation among institutions around the world. The Green Campus programme provided all the information we needed and we created a timeline to appreciate their achievements and role in shaping the culture in the campus community around plastic (Figure 3).
Green Campus Achievements Timeline
Summary of Findings:
Despite recent legislation changes banning plastic, Ireland is not performing as well as it would be expected against SDG 14. Moreover, information about how the country is progressing to meet the targets for SDG 14 is scarce and unclear.
- The Irish Government’s plan on waste management towards a circular economy could have a significant impact to help reduce plastic waste ending up in our oceans, especially the introduction of a deposit-return scheme.
- UCC has an outstanding record of sustainable practices and initiatives that have historically been implemented at a community level.
Observe
Our “Observe” phase consisted of 5 different techniques:
- “Rabbit” Observations
- Twine Journey Map
- Journey Maps with Staff and Students
- Interviews
- Social Listening or Netnography
1. “Rabbit” Observations
In total, we spent 12 hours on campus over 2 different days observing life on campus. This was completed as part of the Artists in Residence Programme using the tools of Artist Carol Anne Connolly. These experiences felt a bit like a rabbit’s vision where I nearly had 360-degree vision and super hearing. I also moved around campus stealthily moving or “hopping” from area to area unnoticed, so I didn’t disturb the normal routines or look out of place. We called this the rabbit technique. This is represented visually in the figure below.
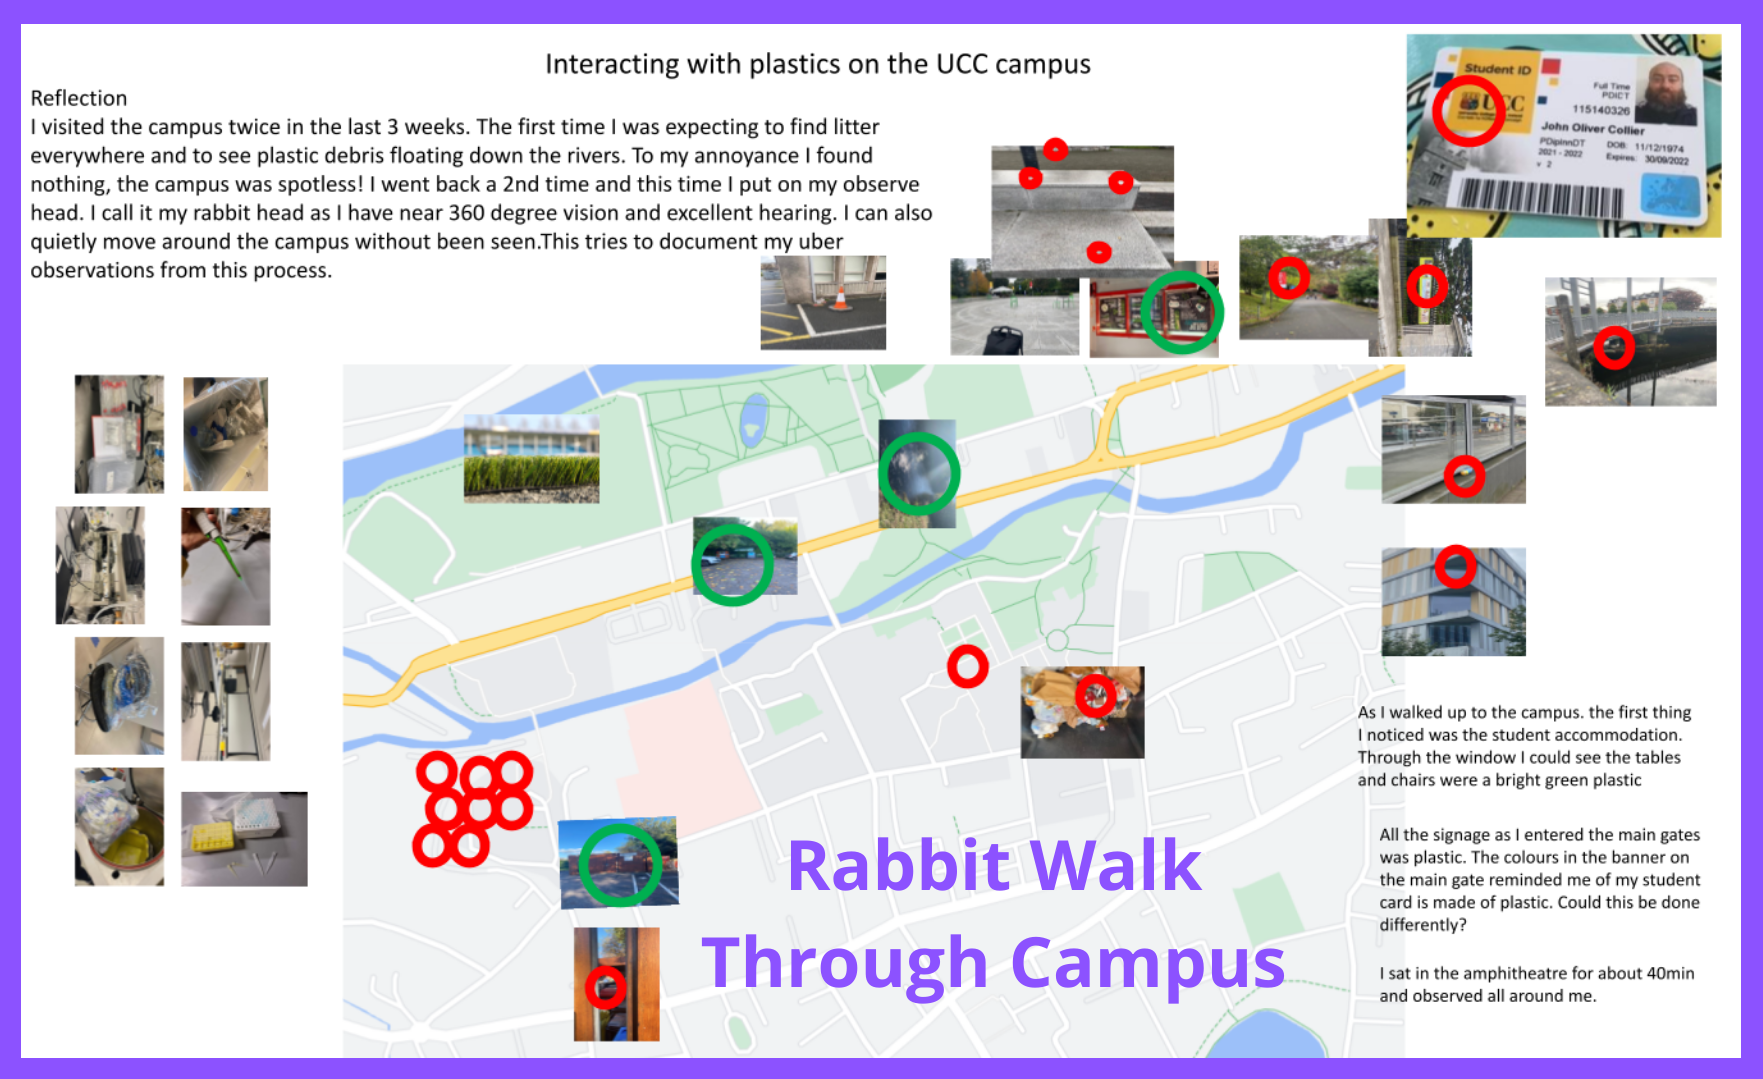
Figure 4: Graphical representation of where plastics were interacted with on the UCC campus.
2. Twine Journey
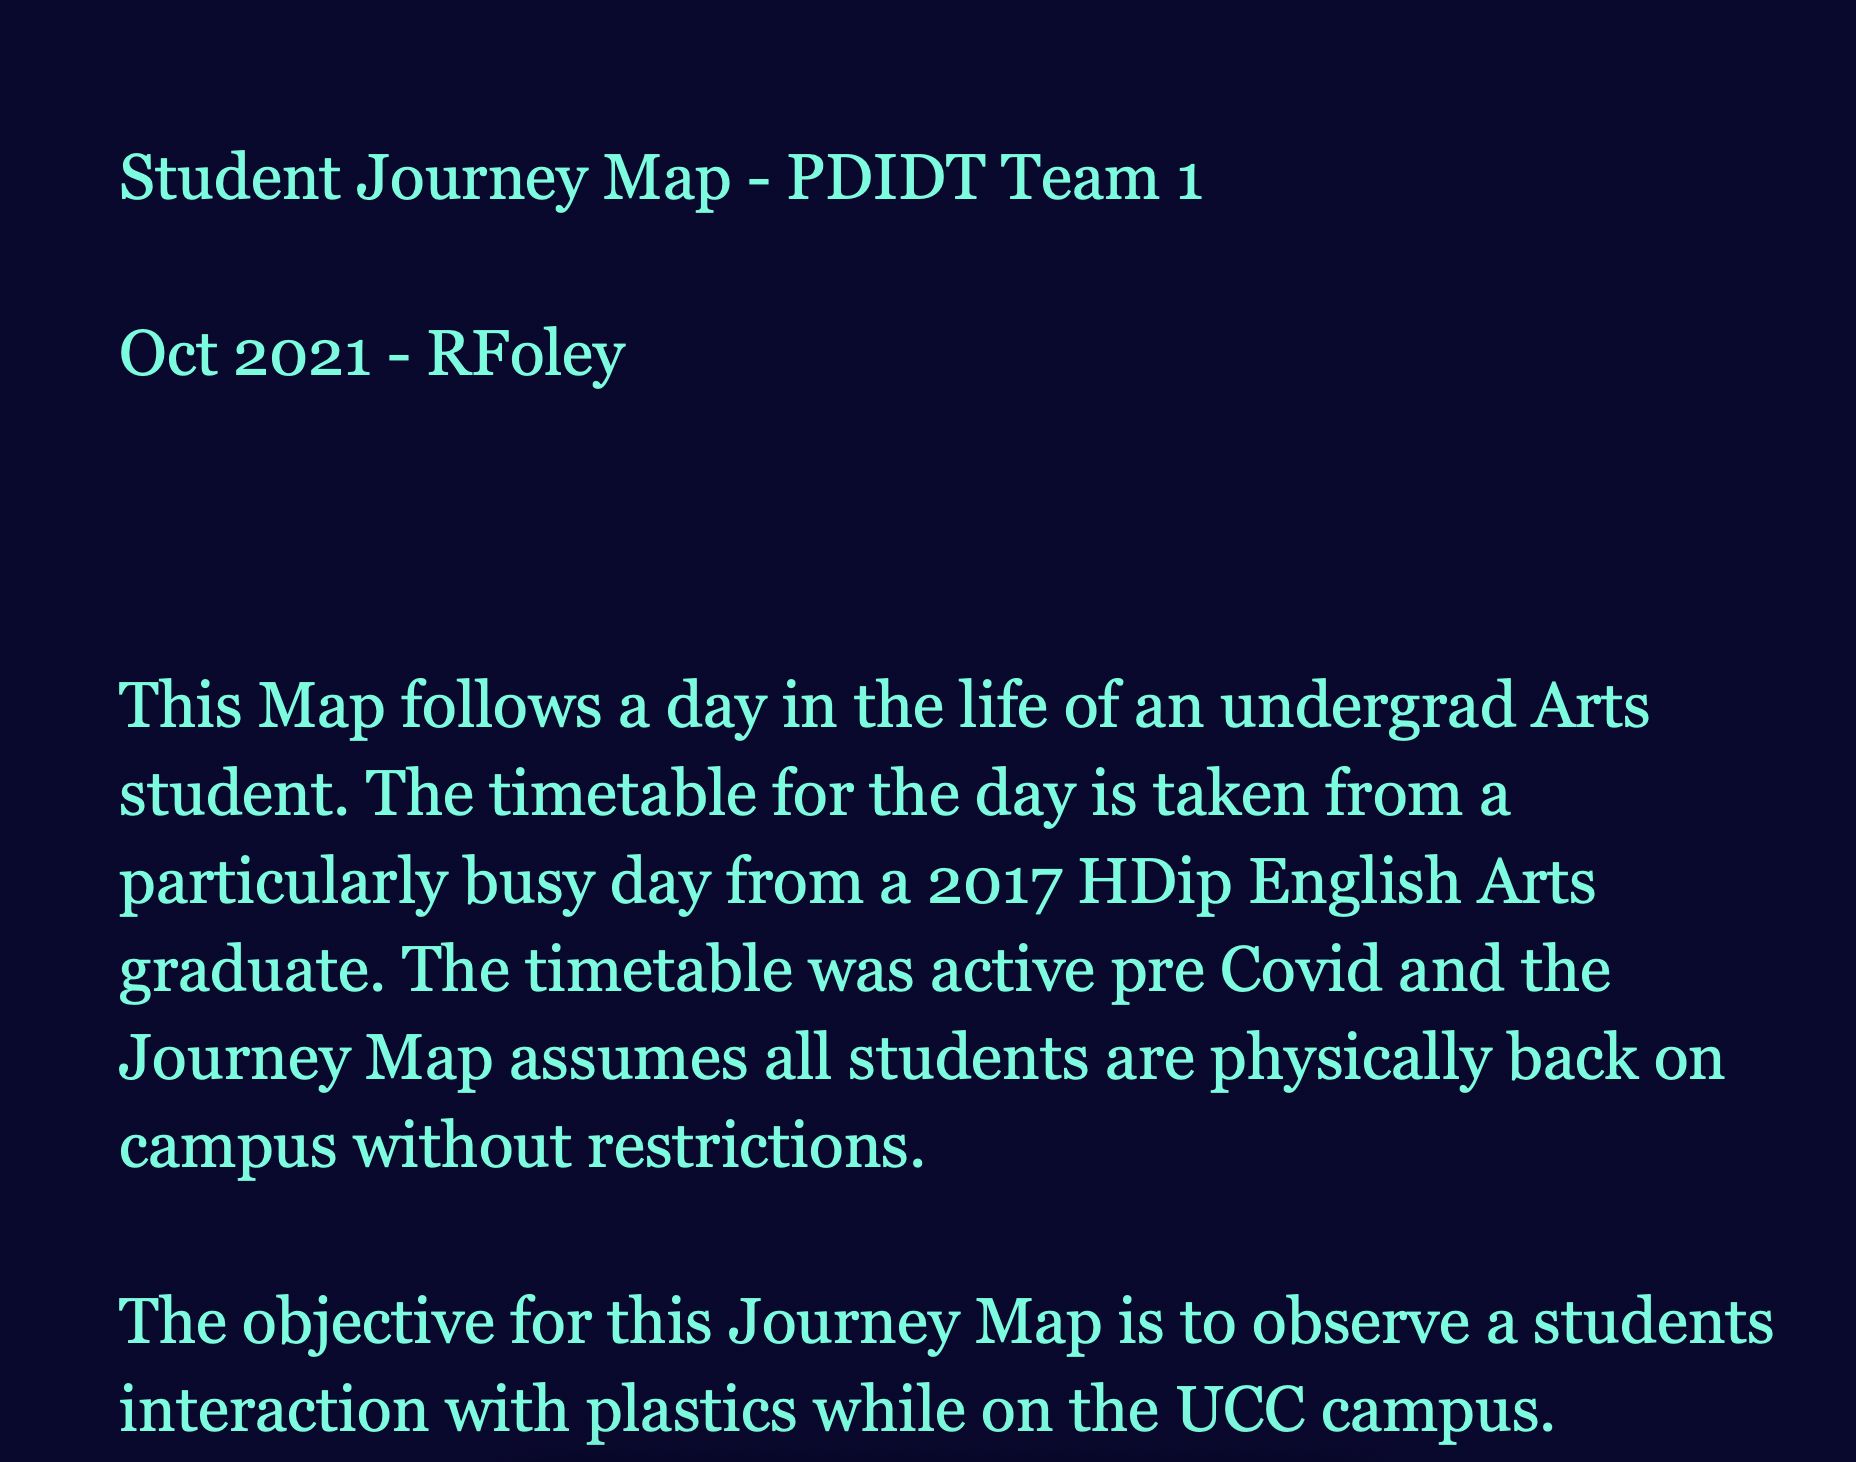
Twine is an open-source tool for creating interactive fiction and is ideal for detailed world-building and telling non-linear stories. This was used to journey map an alternative view of a student’s journey through the campus by looking at the experience as an interactive branching narrative or playable game (Figure 5).
Twine
- Student Journey Map: Twine Back End
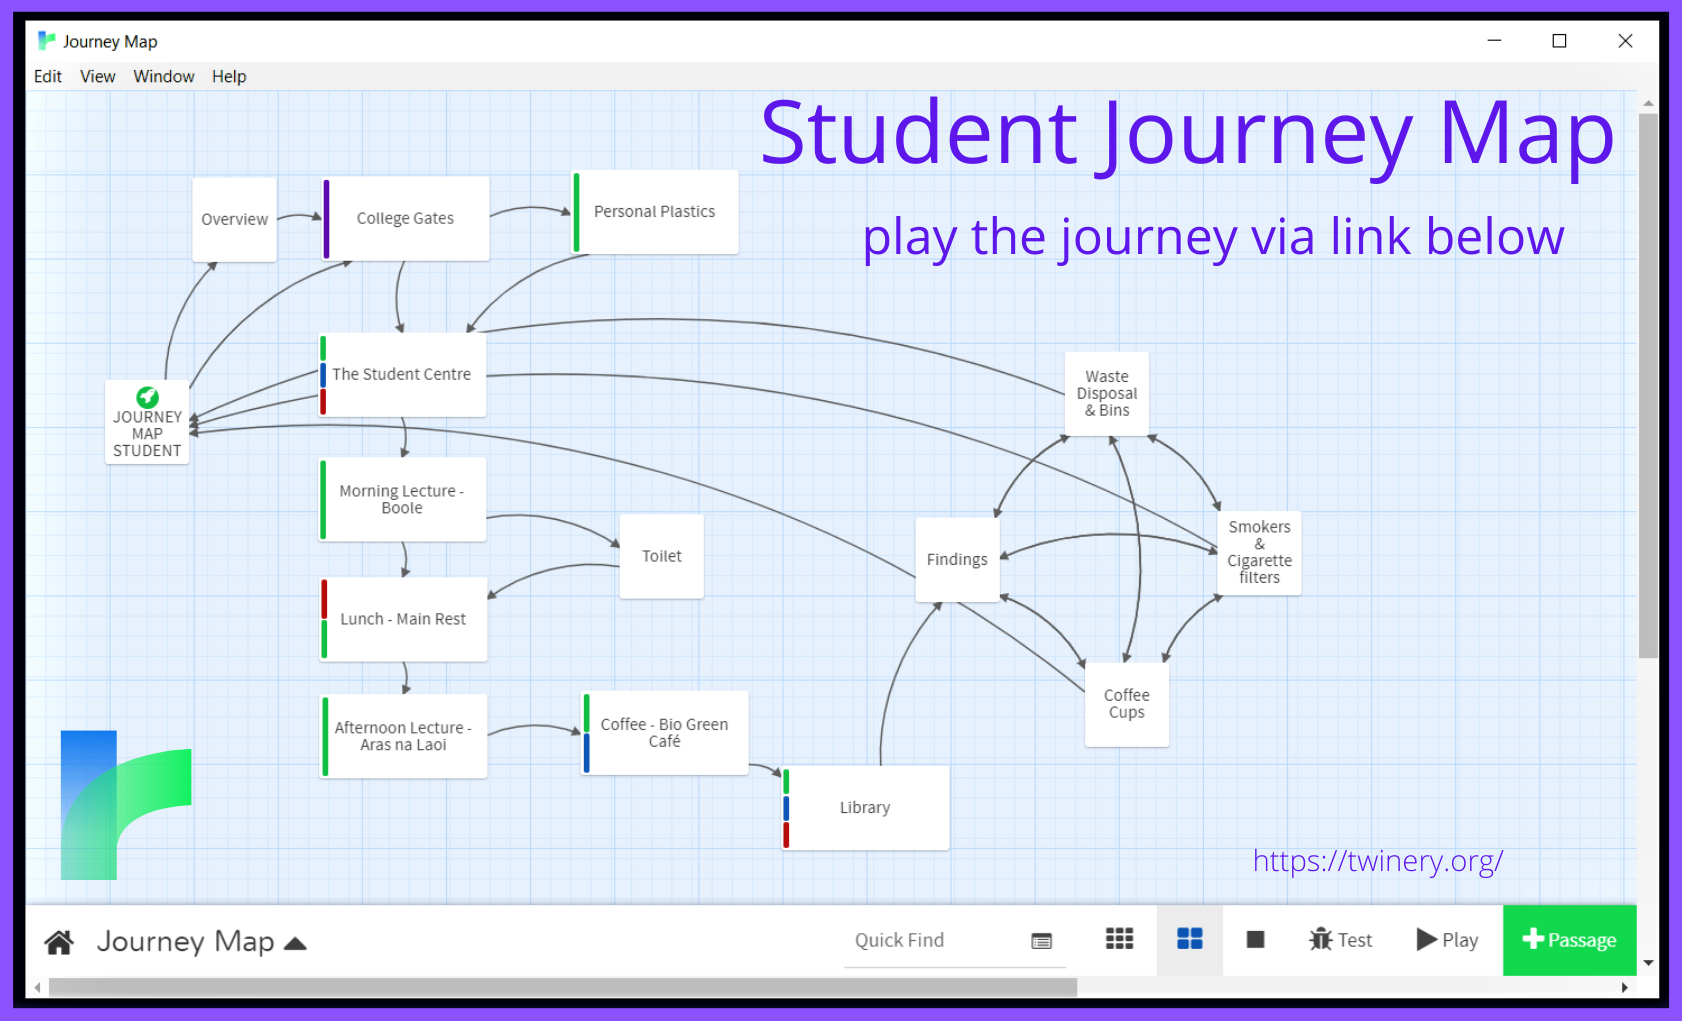
Figure 5: Wireframe of student journey map and where they interact with plastics on campus.
- Download the html file here and open to play in a new tab.
These observation techniques showed that the university is making a conscious effort to reduce plastic usage on campus by supporting reusable cups and food containers in the shops, implementing the correct bins inside buildings to encourage correct plastic management and signage in the Student Centre and Library buildings. We did note that segregation outside of the buildings is not happening. Listening to conversations on campus revealed that there was no discussion about the SDGs or waste segregation.
3. Journey Maps
We completed journey maps with three students. These are viewable below. Two of these interviews were with students (Male and Female from different courses) on the main UCC campus and the third was with a student from the Architecture campus.
Team 1 Journey Maps
4. Interviews
We conducted interviews with staff in UCC to observe differences between the student base and the staff base. We interviewed a lab staff member from Biomedical Sciences, a member of the maintenance team in the Architecture College and a member of the grounds staff on the main UCC campus.
Interviews
5. Social Listening and Netnography
Finally, social listening was used to identify if staff and students are talking about plastic waste online through a number of social media platforms. This study showed that conversation was lacking completely. There were loads of conversations about hungry students, carbon economy and COP26 but plastics and the effect of the University were completely missing. This study is represented in the following video.
Team 1 Social Listening Report
Summary of Findings
From our Observe stage, the following points were noted as significant.
- Students are not aware of the Sustainability Development Goals. Staff are aware and are encouraged to do short courses on the topic but this does not filter down to students.
- Students don’t care about waste segregation. Maintenance staff on both campuses said that they leave their rubbish everywhere and the recycling bins are not used correctly so all waste goes down one route. Even when provided with the facilities i.e. in the Library and the Student Centre, waste is still mixed. Eg coffee cups in the recycling bin when they cannot be recycled.
- There is no conversation happening either on the ground or online around plastic waste. Students are aware of plastics and know that they are wearing them, but do not feel empowered enough to actually inform others.
Point of View
All the techniques we used during our Observe phase provided enough data to create two personas that could be used to portray our key findings: Anja, a second-year student and Colin, a lab staff member (Figure 6). In addition to these, we reviewed our stakeholder map and decided that to be able to form our point of view, we also needed to include Gaia, mother Earth, in this stage. We created an empathy map to visualise what we had learned so far about the impacts of plastic on the planet (Figure 7); this technique also helped us inform our personas.
Team 1 Personas
Meet Anja and Colin
(click the image below to open in a new tab)
Figure 6: Video representation of different personas
Gaia Empathy Map
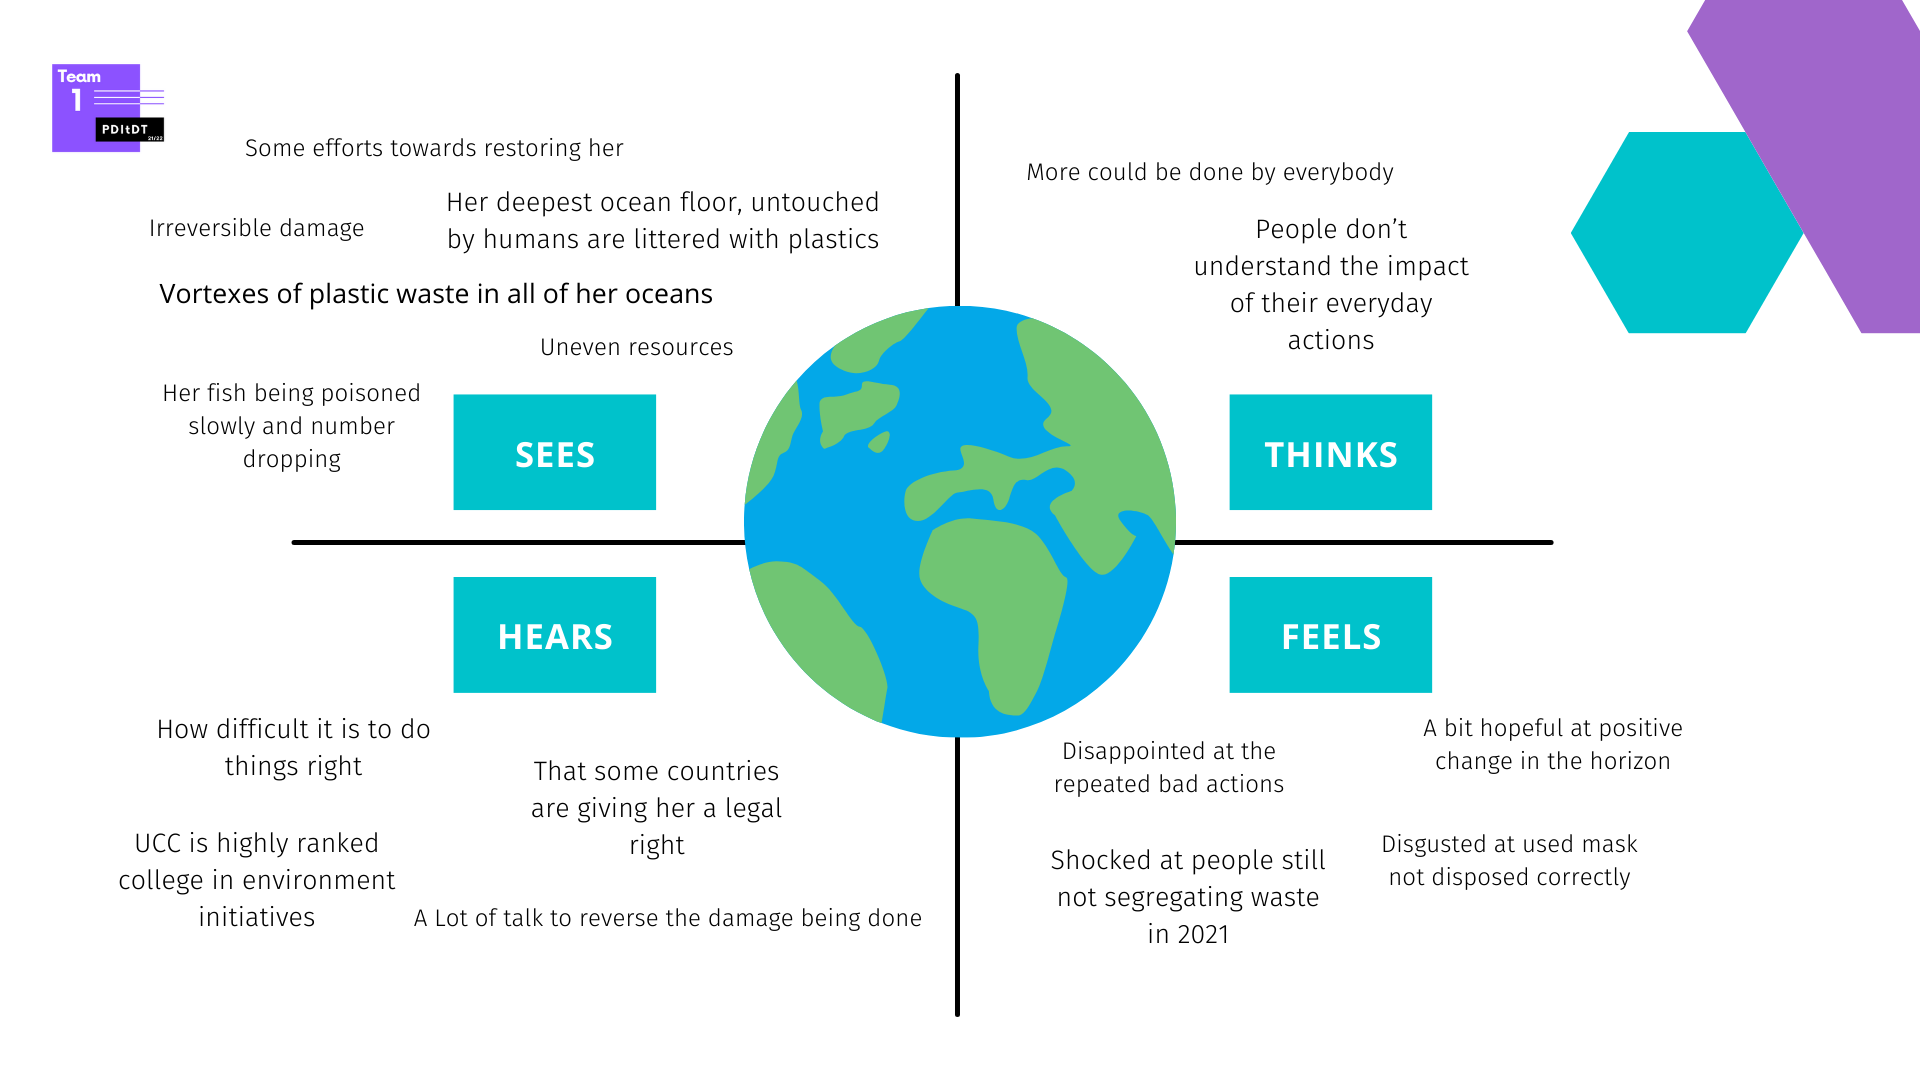
Figure 7: Illustration of Empathy Map for Gaia representing the voice of Mother Earth
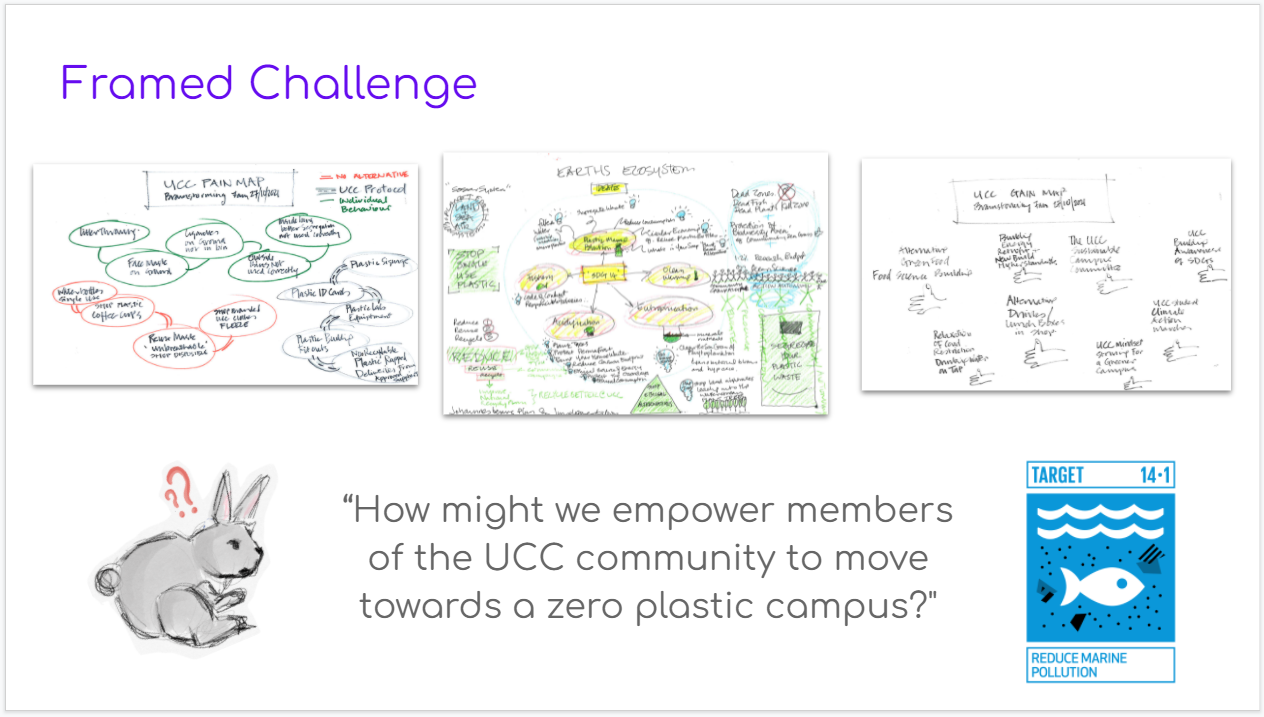
These techniques lead us to formulate a Point of View (Figure 8) that would encapsulate our findings and would help us refine our framed challenge to its final version.
Point of View and Reframed Challenge
-
Point of View
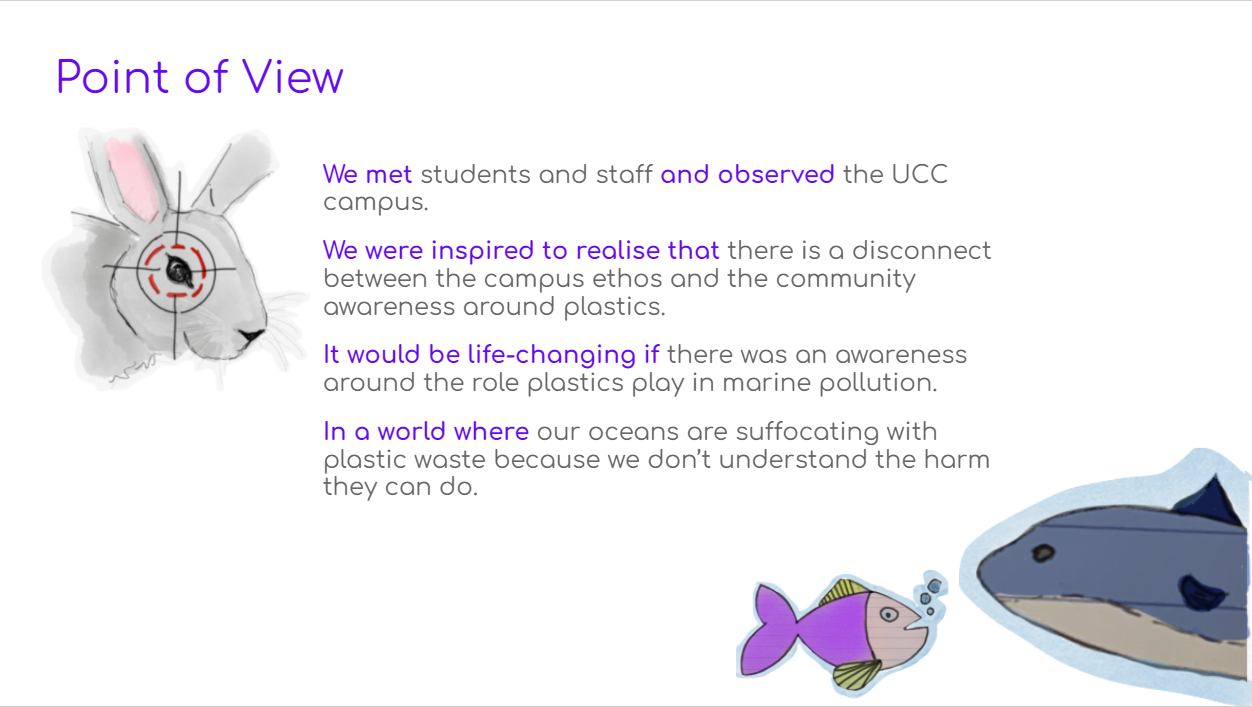
Figure 8: Illustration showing the Point of View Statement
-
Reframed challenge into a “How might we…?”
Ideation
Now that the problem statement “How might we empower UCC Staff and Students to make UCC a Zero-plastic campus” was decided on, the ideation stage was started to identify potential solutions. Three different ideation techniques were chosen to do this.
- Brainstorming
- Flip it
- Benchmarking your role model company (What would X do?)
Brainstorming
We conducted a brainstorming session over zoom with the team and with the students from Heilbronn in Germany to come up with potential solutions. The team was cognisant that while there was diversity in our team, there was not a variety of ages and felt it was important to bring in the voice of the student. We invited our colleagues from Germany to bring the voice of a younger student to the process and as Germany is more advanced in terms of waste segregation than Ireland, they represented valuable expertise in the waste segregation area.
The IDEO Brainstorming rules were followed as per the video below explaining the IDEO process (Figure 9). The divergence of ideas is represented in the whiteboard of various ideas generated as per Figure 10.
Brainstorming
Figure 9: Video showing the rules of Brainstorming by IDEO (ABC News, 2009)
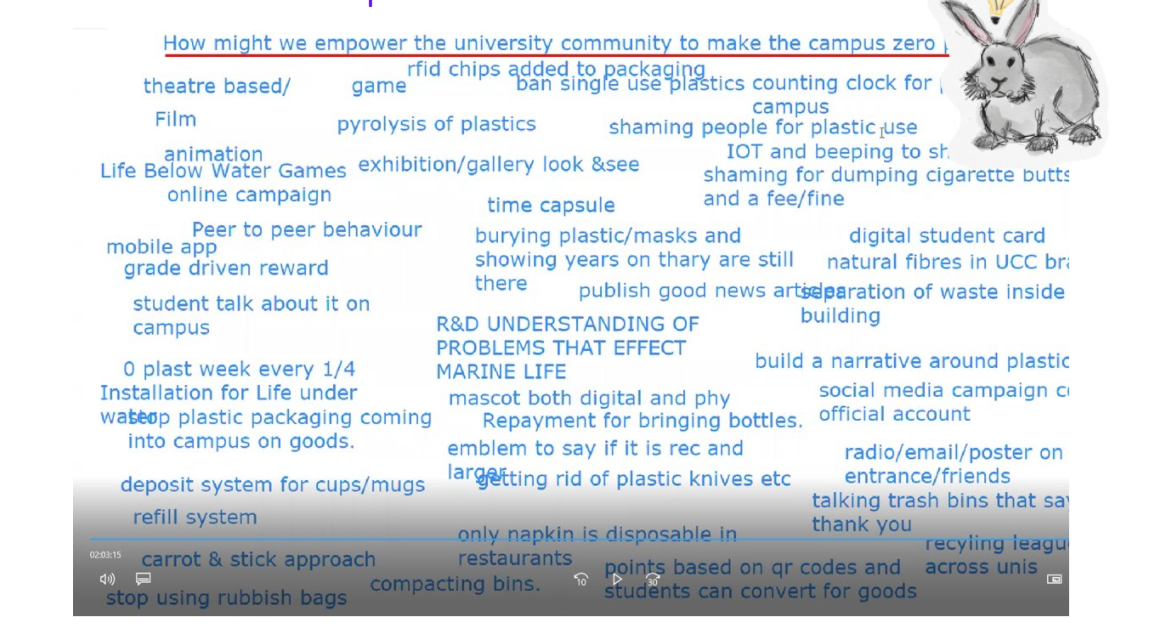
Figure 10: Screenshot from Zoom showing the capture of ideas through the brainstorming technique.
Flip it
The team was asked to think of the most negative aspect of our research and then flip it into something positive. Table 3.2 below represents this process.
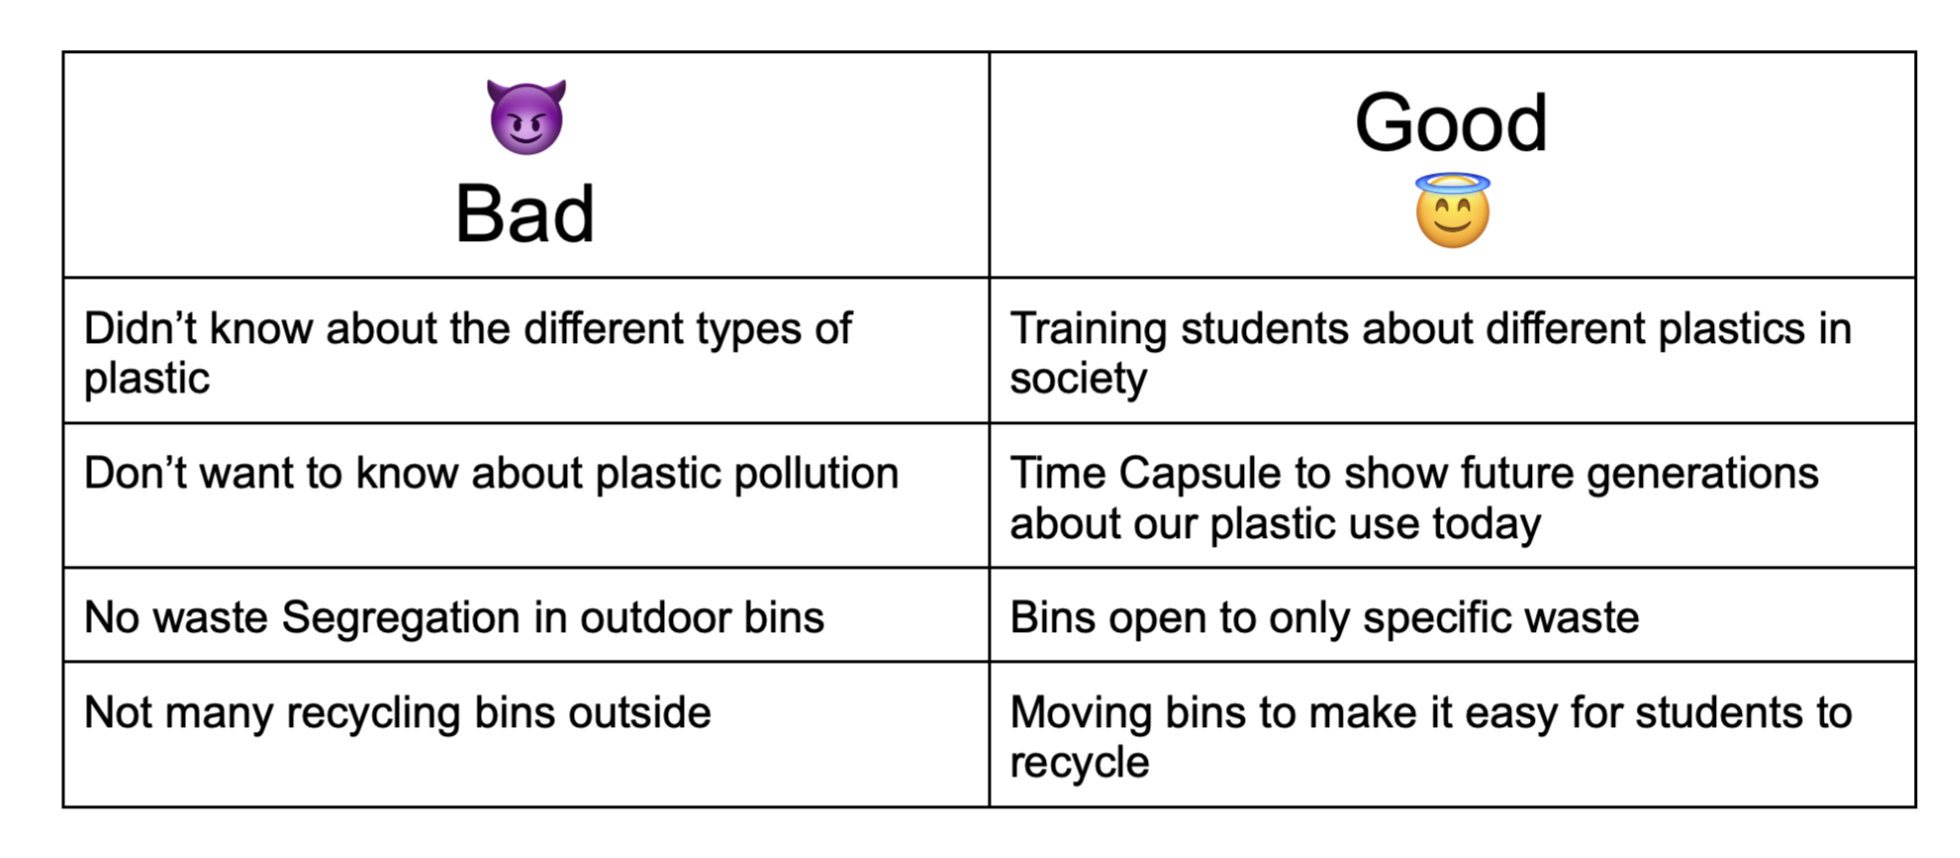 Table 3.2: Table showing the flipping of negatives into positive outcomes.
What would X do?
At the start of the brainstorming, session participants were asked what companies they admired in terms of ethos, pathos and logos. As a final remark at the end of the ideation process participants were asked then how they thought their preferred company would address this issue. Examples of responses are shown below (Table 3.3):
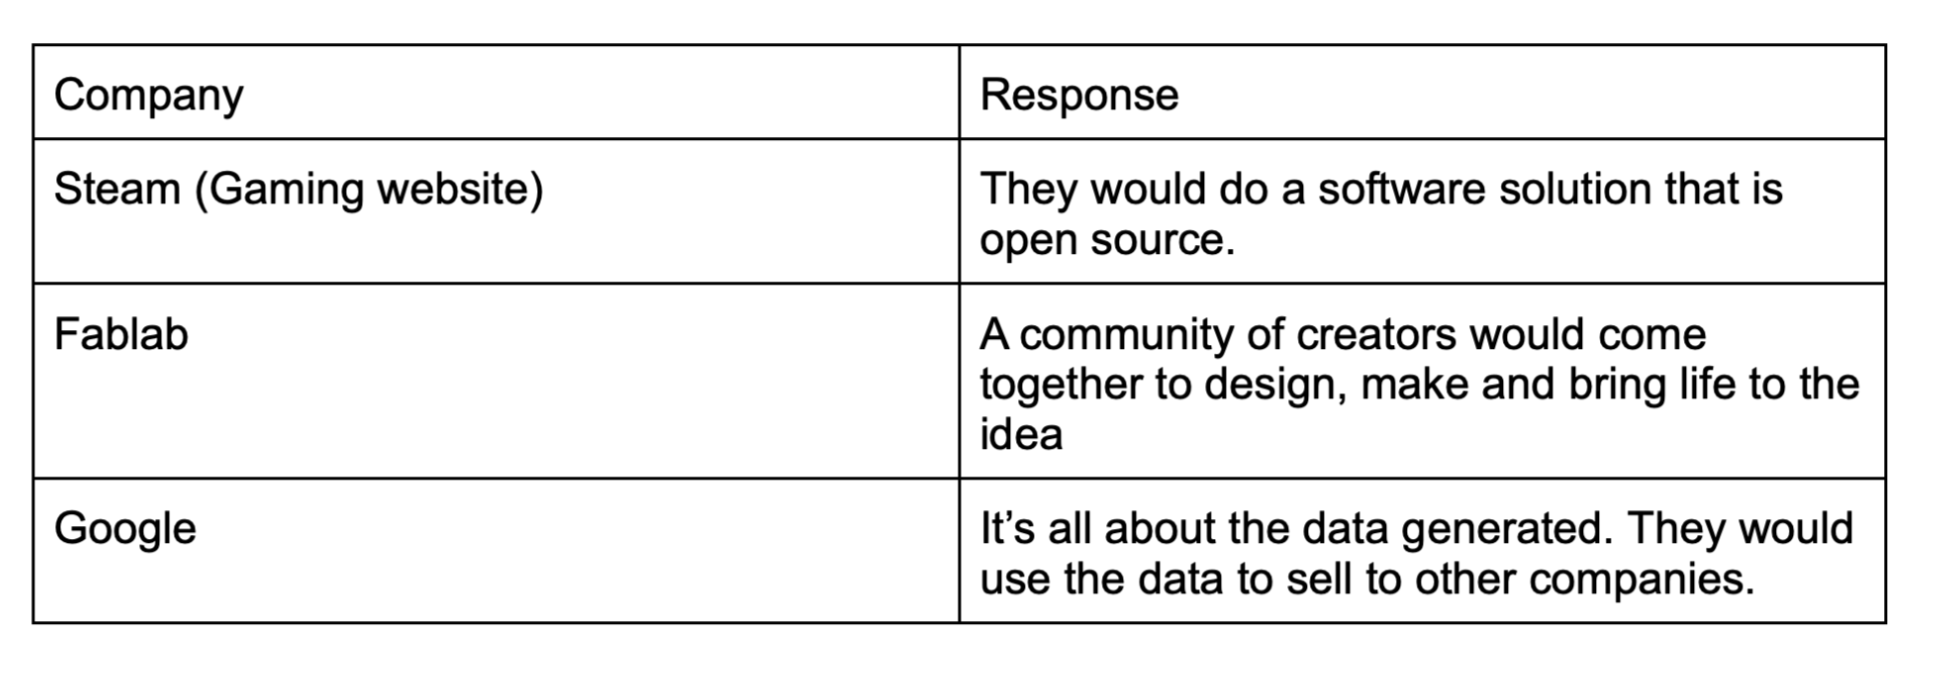 Table 3.3: Table showing the results of the idea generation using the “What would X do” technique.
Convergence & Findings
These ideas were documented on a whiteboard for everybody to see (Figure 10). Each team member was given 5 votes and all the ideas were converged down into 3 main ideas or concepts. These were about having a Deposit Return Scheme on campus, a mascot to encourage students to recycle correctly and a system where part of a student’s grade is determined by their integration of sustainable practices. Prototyping then started with these concepts in mind.
Prototype
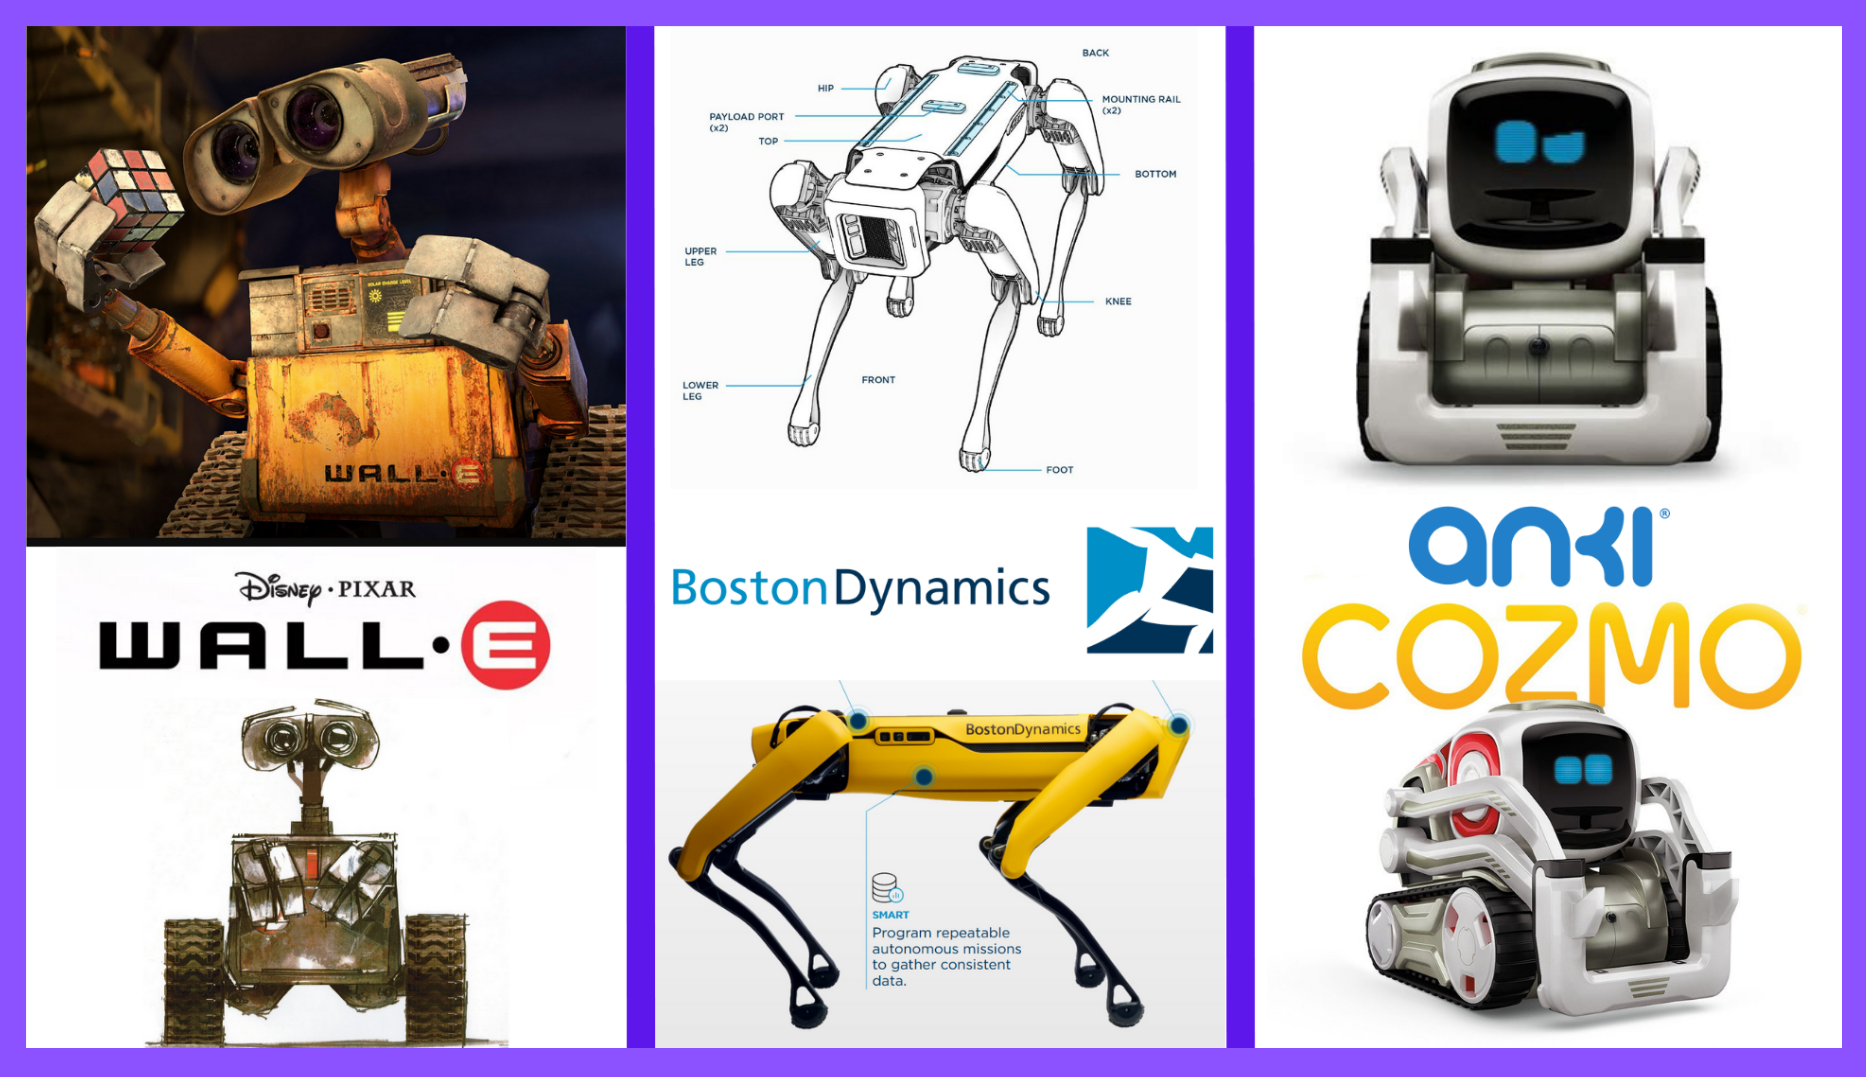
Once we had decided on our top three ideas, we created a concept board to help us with our future prototype (Figure 11).
Concept Board
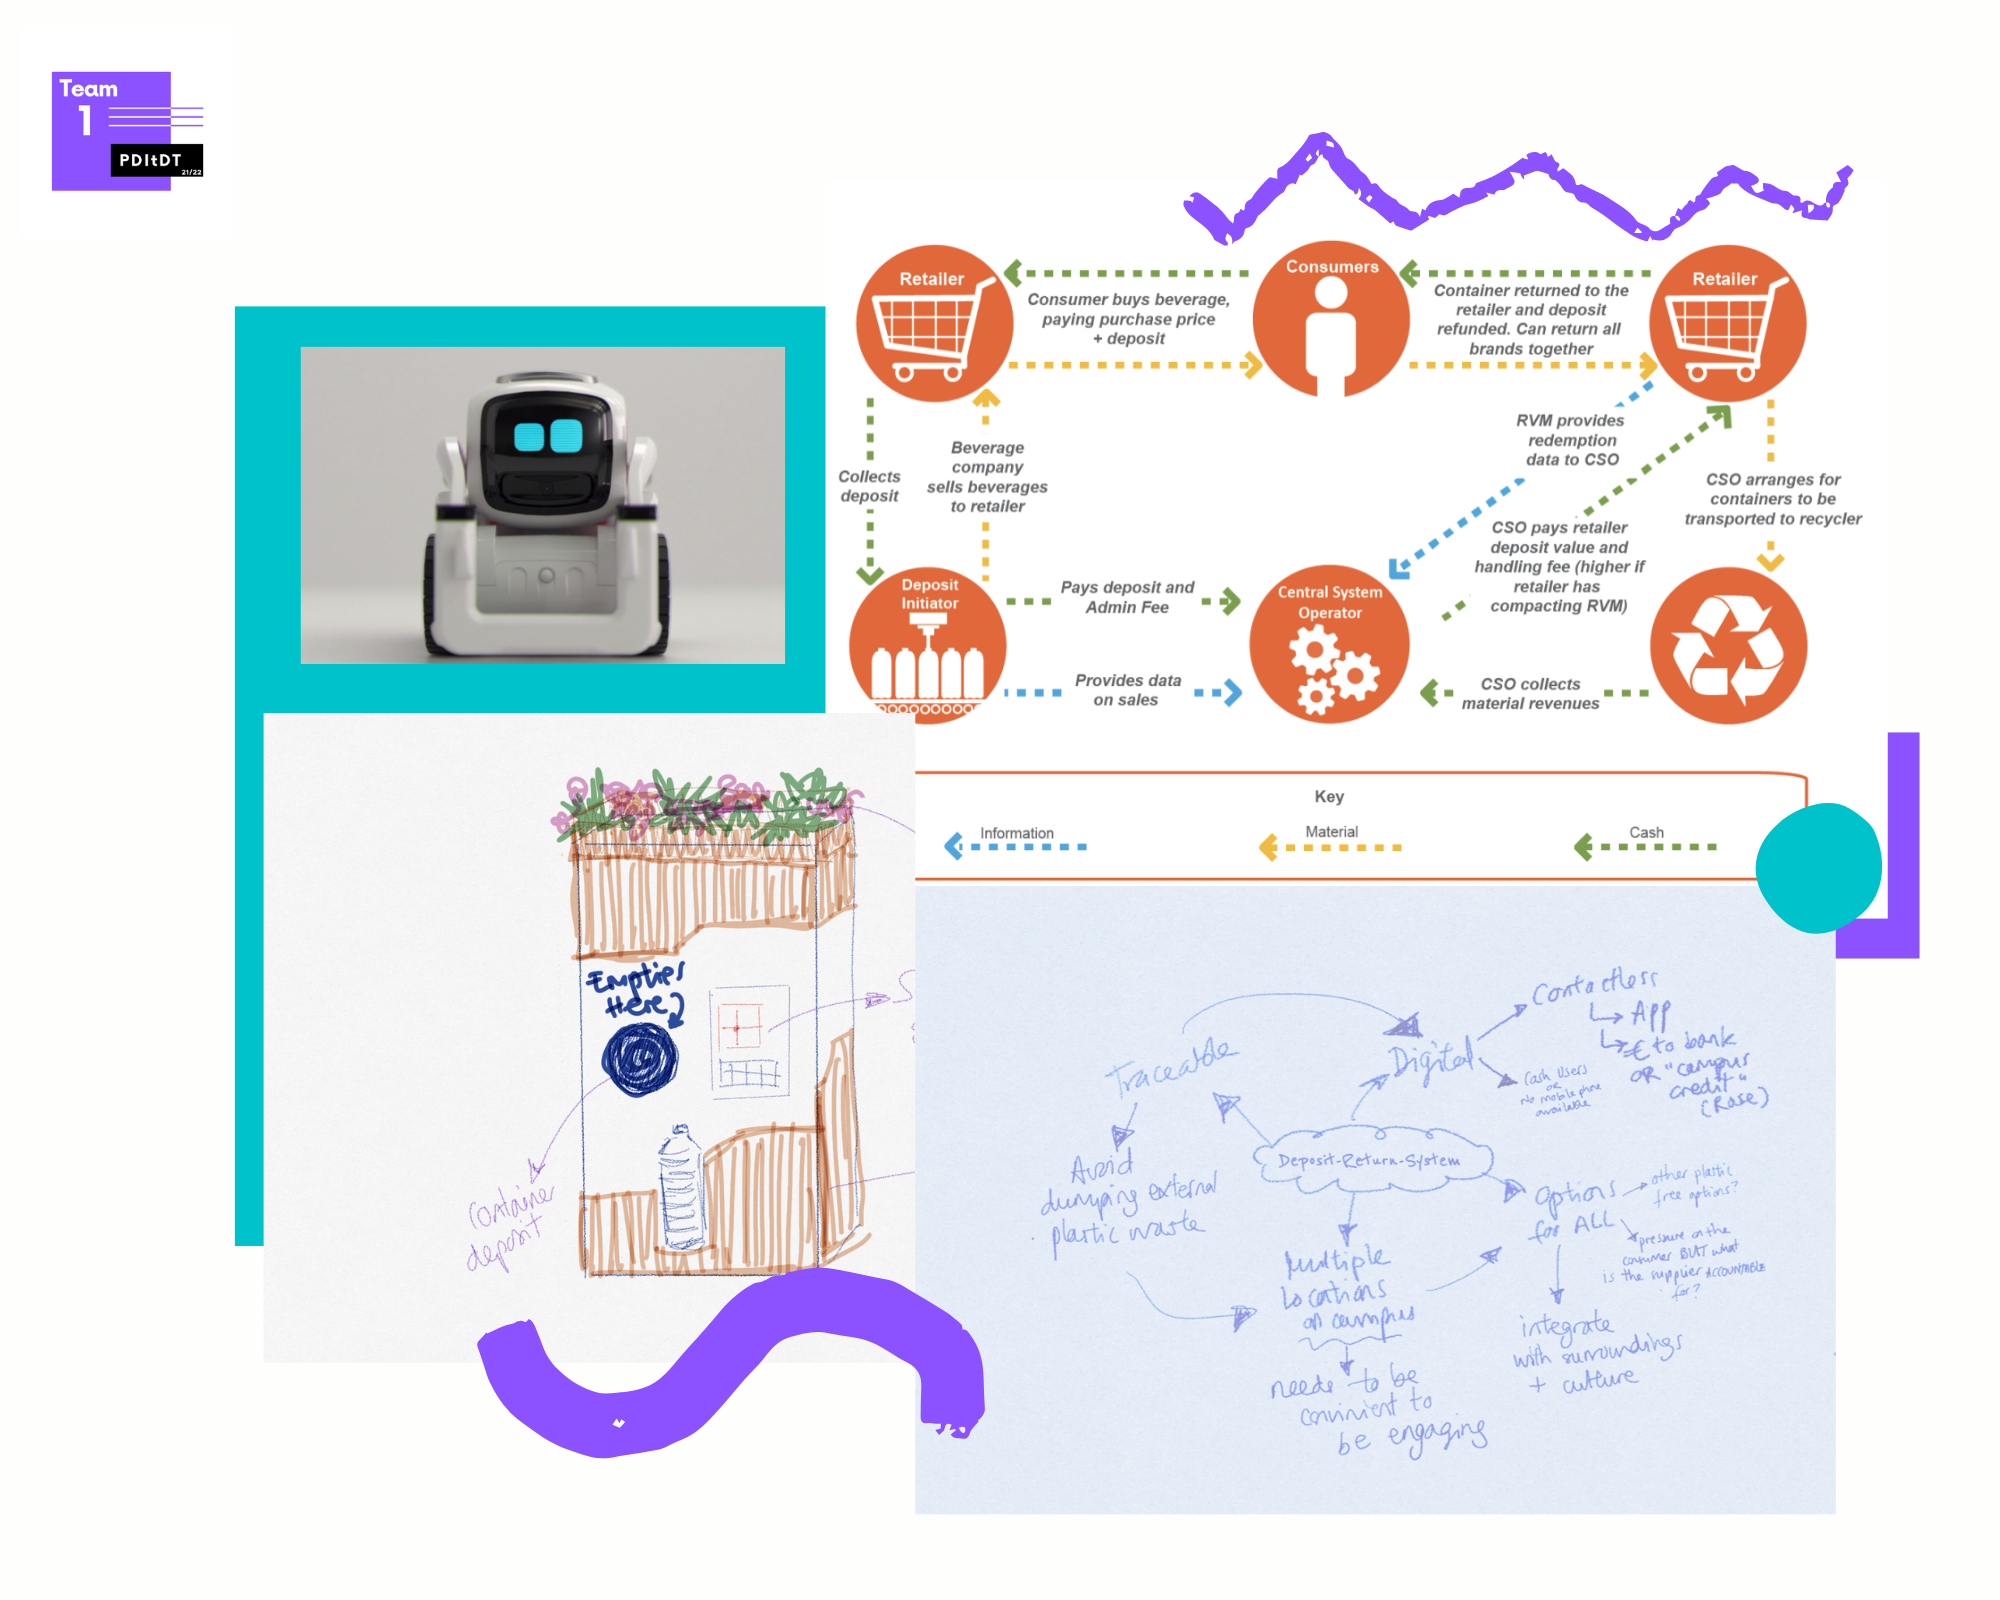
Figure 11: Inspiration Mood Board showing robot ideas.
We instantly agreed that the concept of an anthropomorphic robot could help us combine two of our top ideas, the concept of a mascot and a deposit return system. We would still need to figure out the system that would allow the user to interact with this bot, although our initial idea was leveraging the student/staff ID card. We also needed to consider essential factors in the design of this bot before we could create a prototype and to achieve a decision that would be free of any bias, we created a table with a series of neutral questions to help us in this process. The result of this exercise produced the first iteration of our new prototype: BRÚS
BOT Prototype Design Process
-
BOT Prototype Questions for Design (Excel)
-
BOT Inspiration Mood Board
-
BRÚS Prototype (click the image below to open in a new tab)
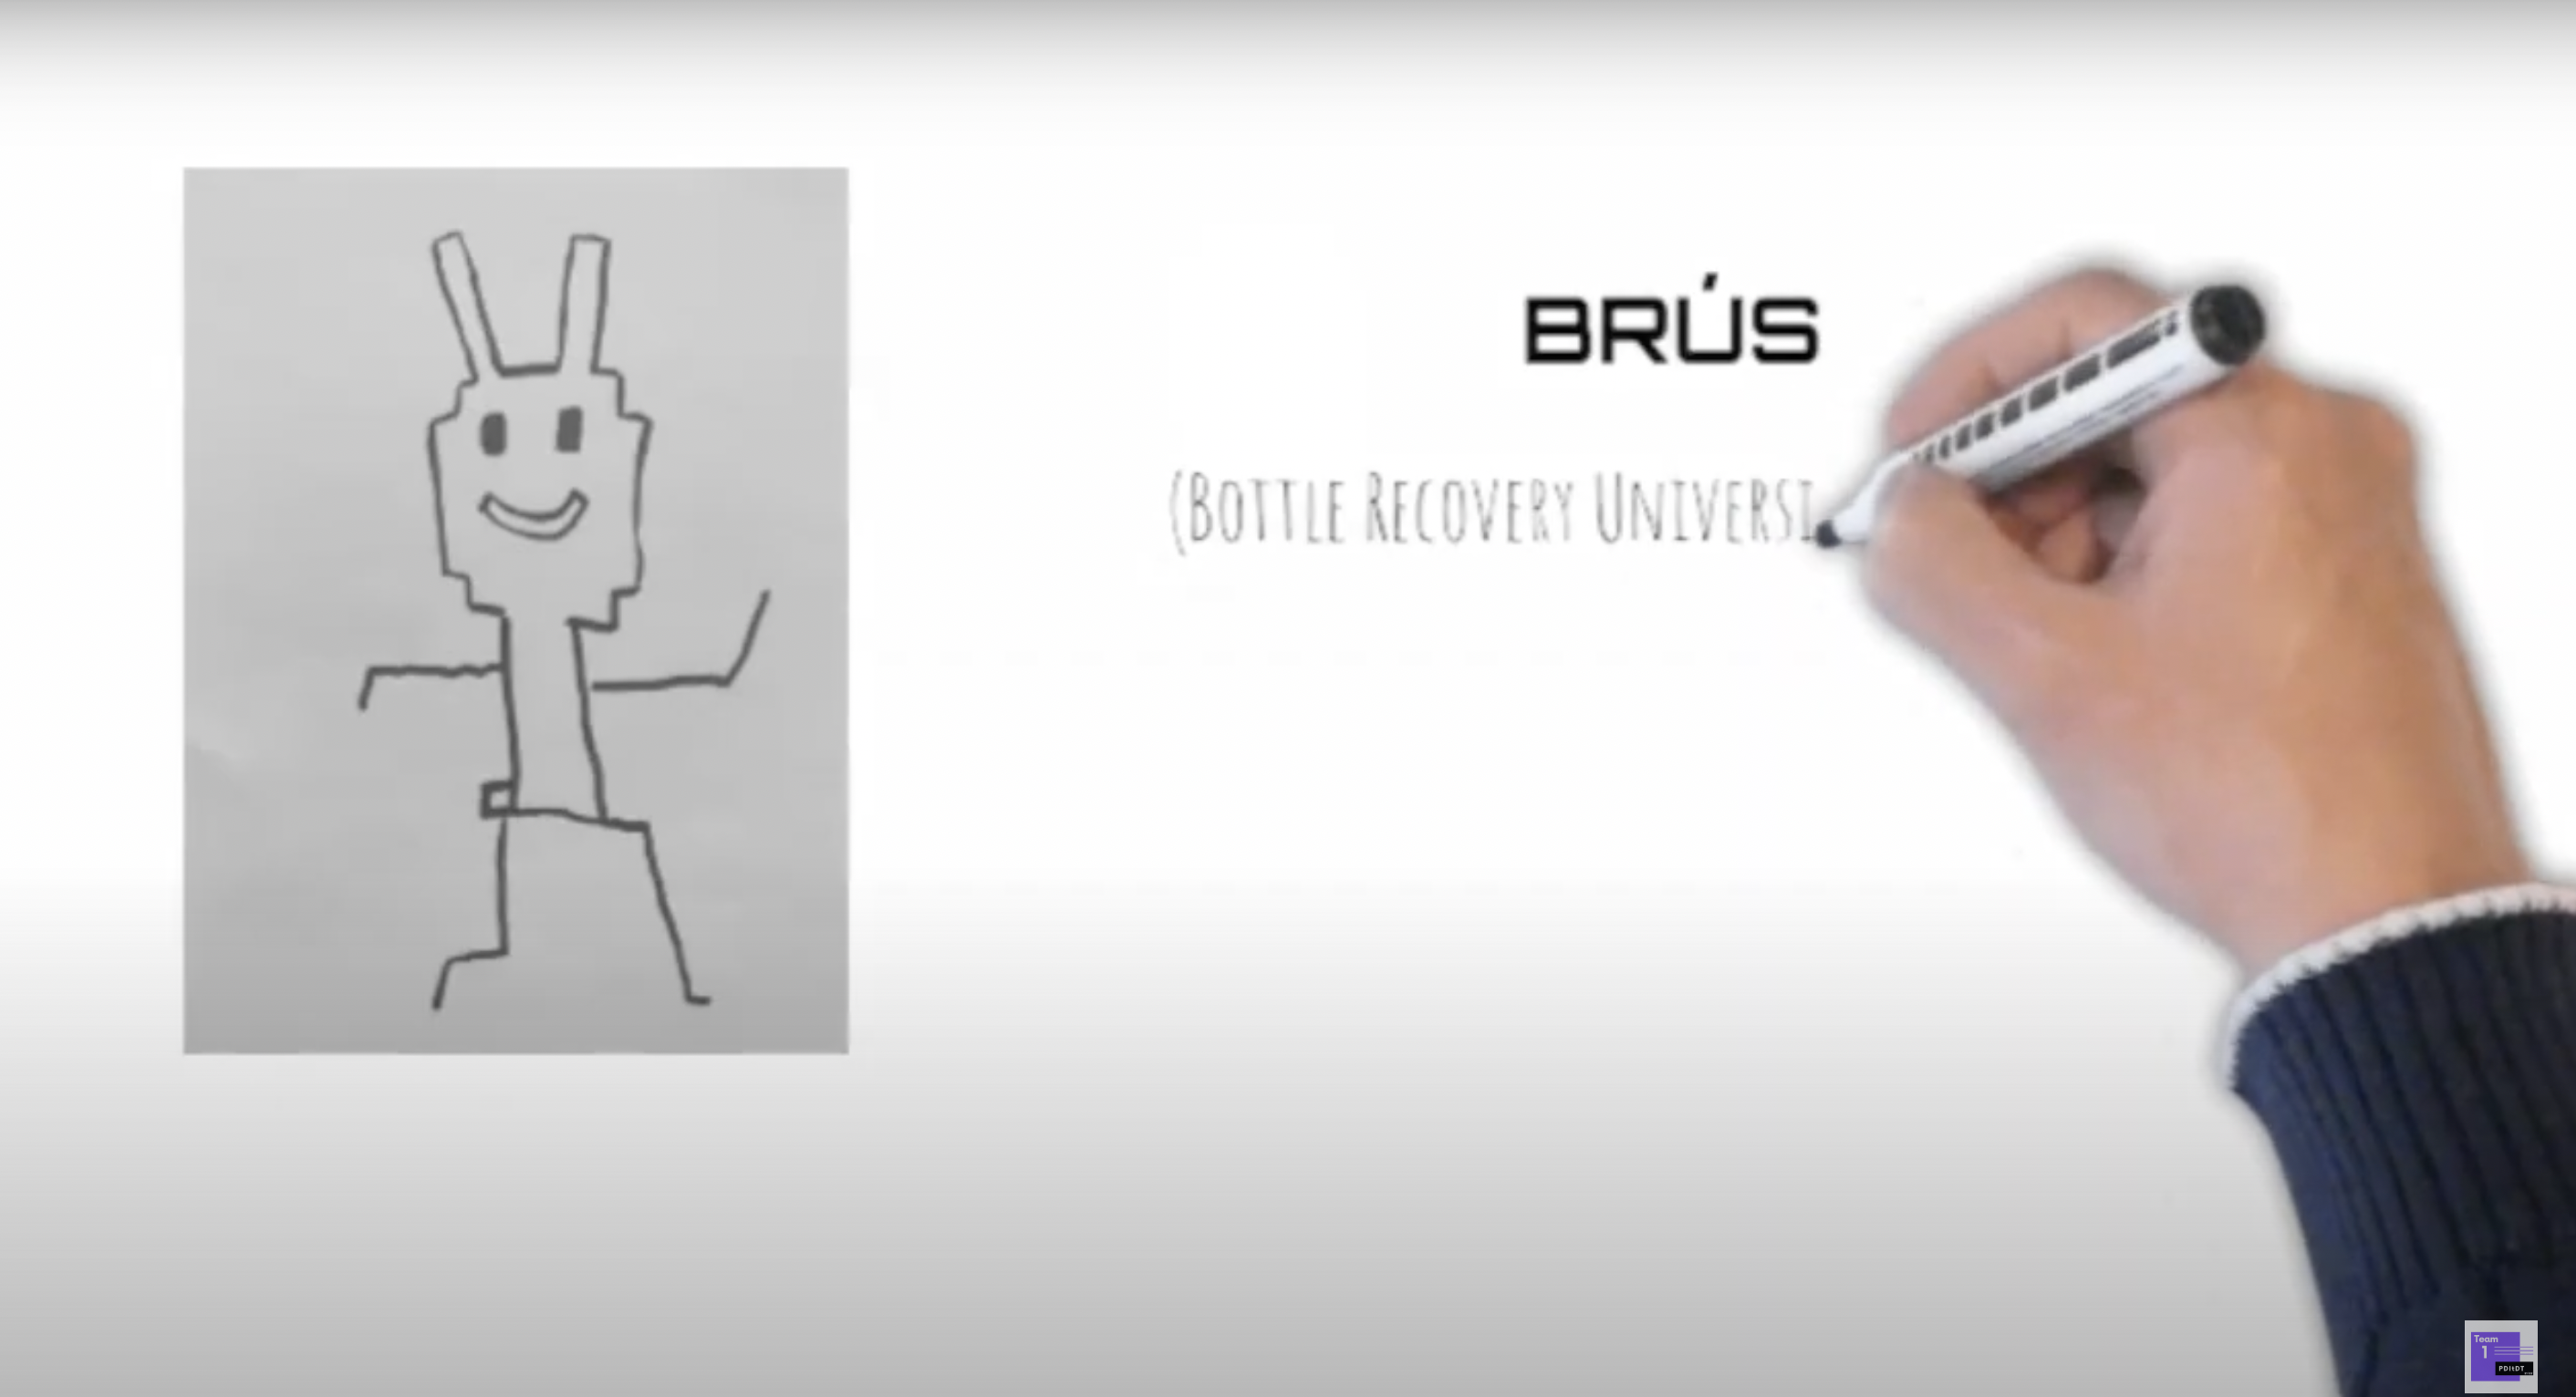
Figure 12: Video showing the first prototype of BRÚS.
Test
The prototype video was shown to our persona (Ronan and Anja) as well as some other students on campus. They really liked the idea of BRÚS. They didn’t want to hear the messages about its effect on the environment but they really liked the idea of getting paid to recycle properly. They could see BRÚS being a mascot on campus and were really engaged with the concept. They were wondering what it would look like.
We also interviewed Dr Maria Kirrane, a sustainable development expert with UCC and she loved the idea too. She wanted it to be made from recycled plastics and electronics and not to be over-engineered. Her body language was open and positive when introduced to the BRÚS prototype.
Test Insights and Final Prototype Iteration
-
Our Testers
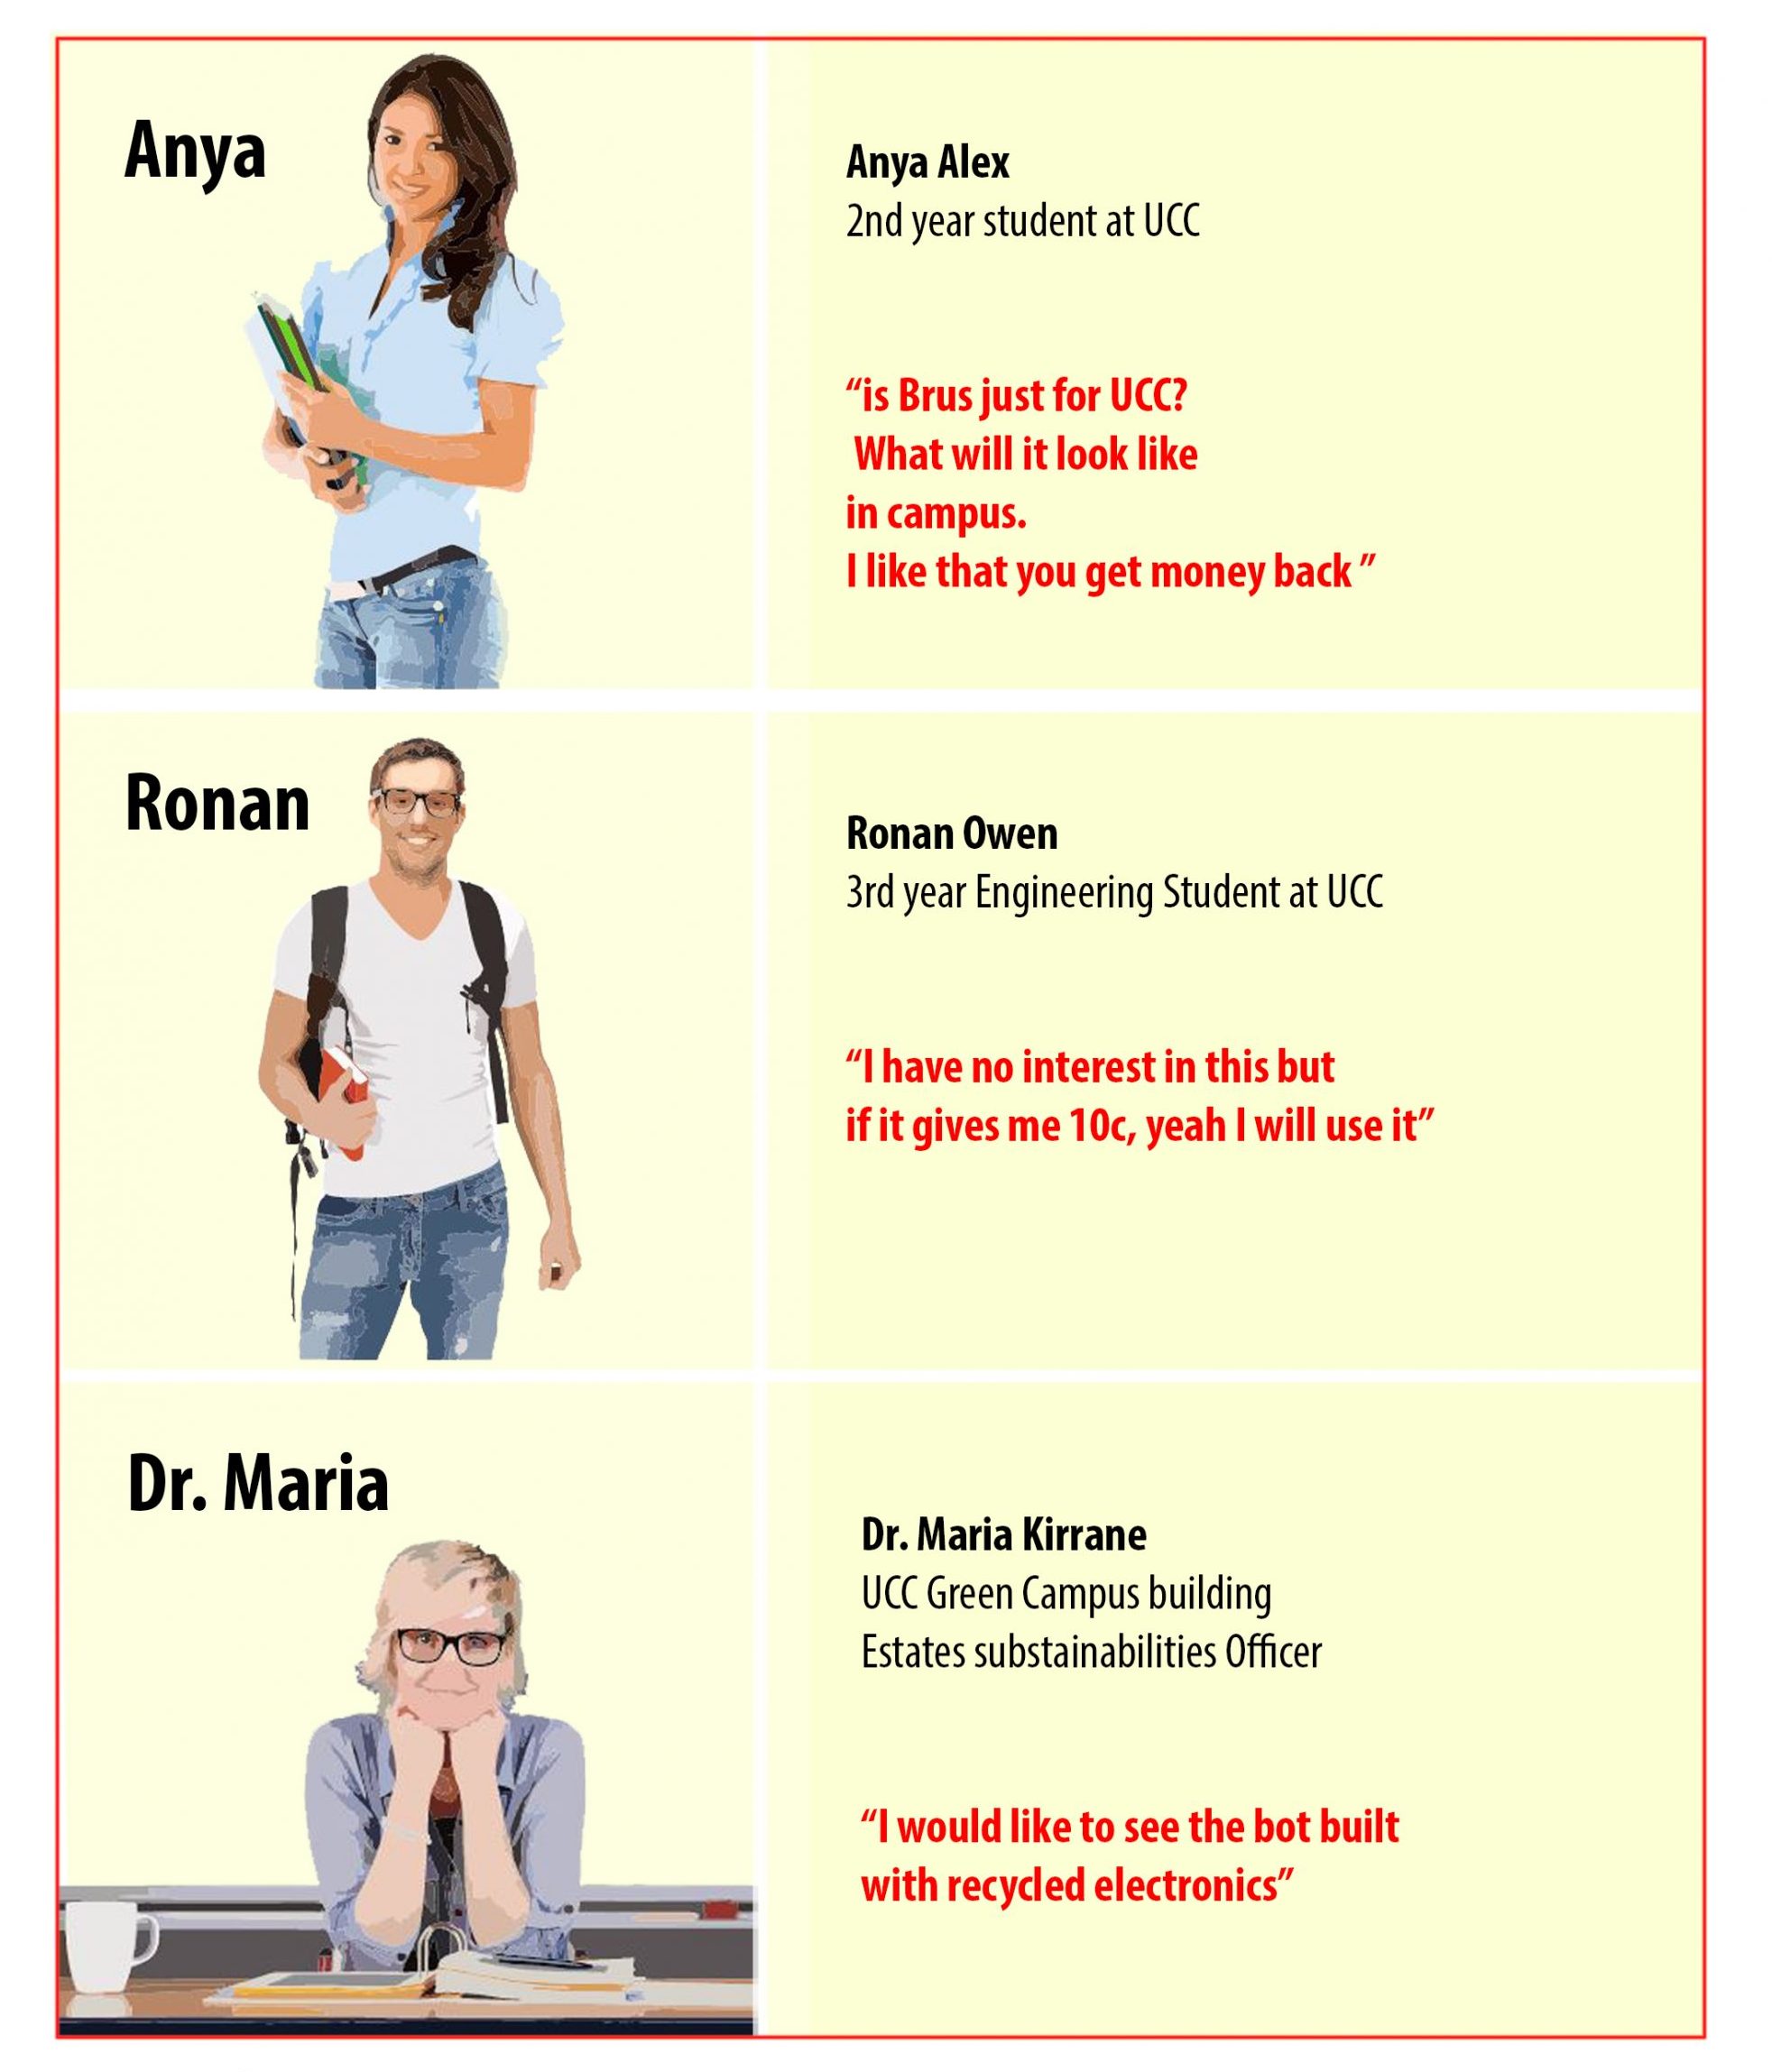
Figure 13: Illustration showing the personas we tested our iteration with.
-
Our Test Insights (click below to open in a new tab)
Figure 14: Video summarizing the results of the Test Phase.
-
Prototype Final Version (click below to open in new tab)
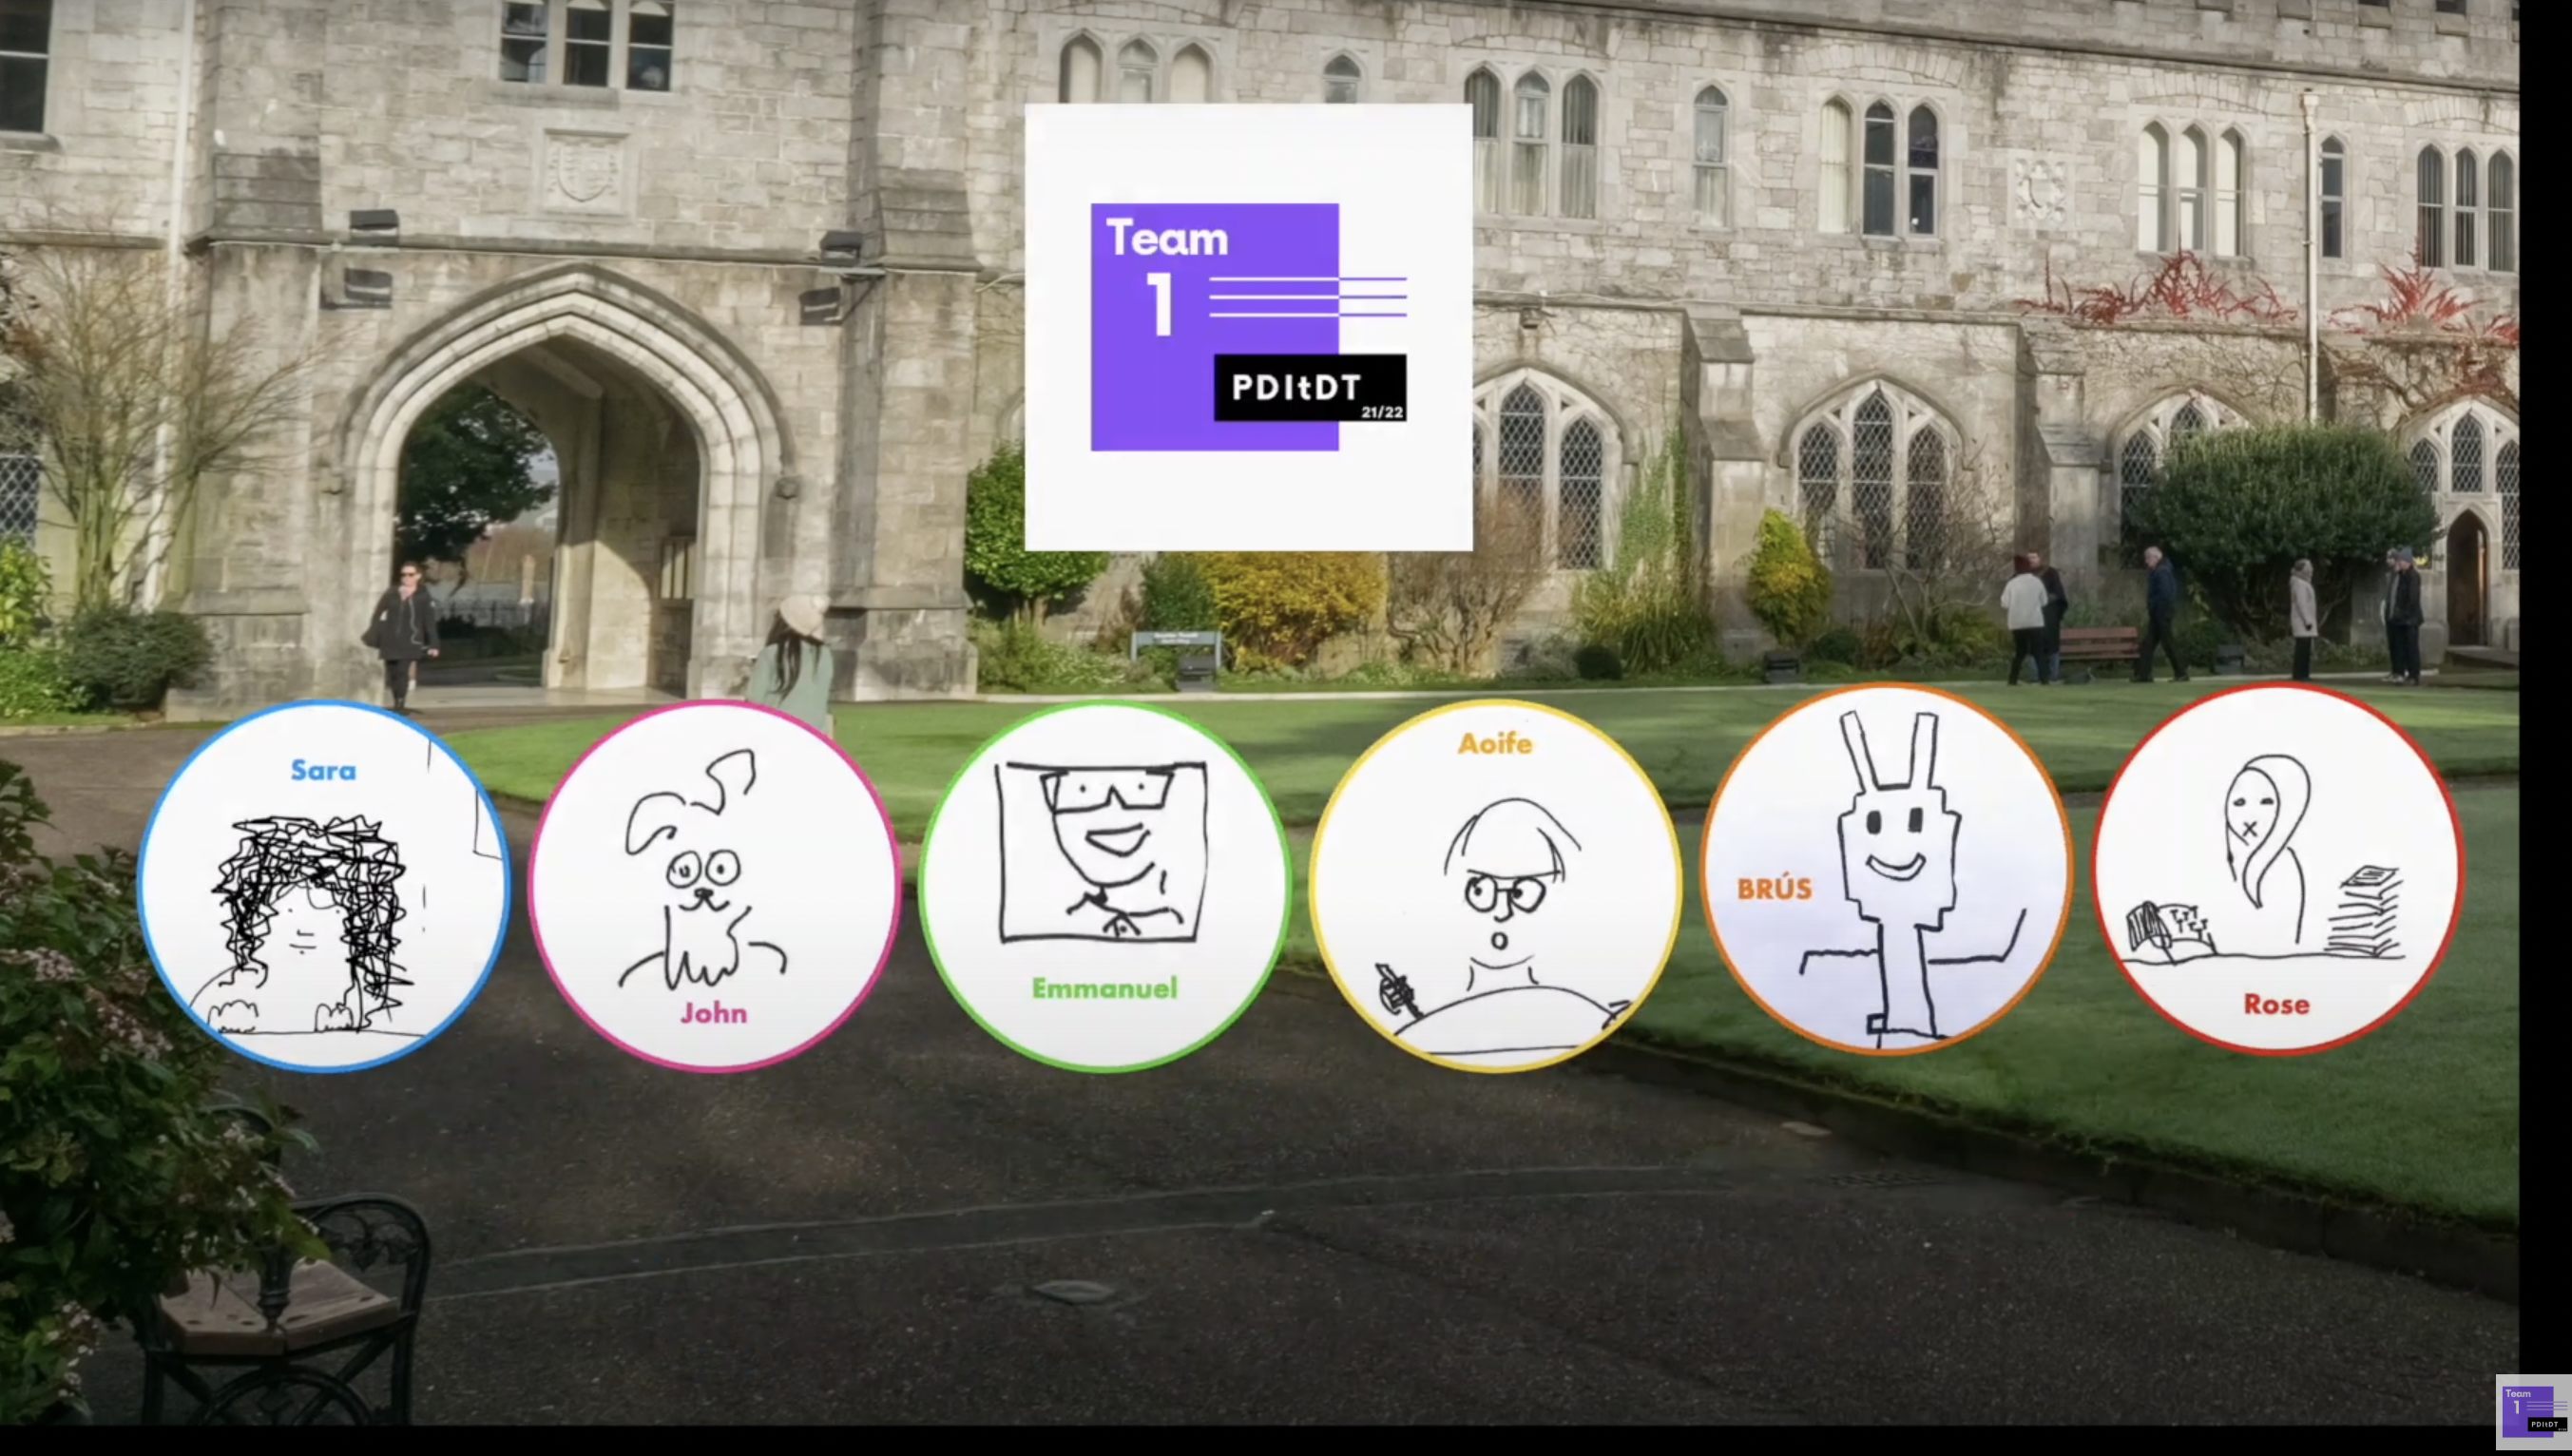
Figure 15: Full video showing the most recent iteration of BRÚS as presented at the showcase of final ideas.