
Chapter 3: Weaving Data — Making Data Visible and Tangible
YongHong Chen
3.1 Collecting and Preparing the Data for Weaving
Recording the Data
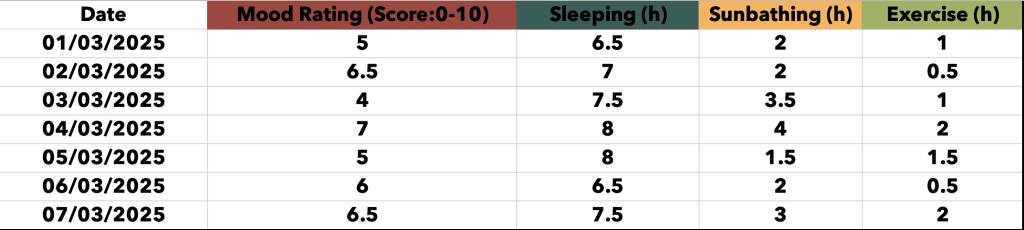
Start by preparing a spreadsheet to record the relationship between your daily mood levels and key lifestyle indicators such as sleep duration, time spent in sunlight, and exercise (see Figure 3.1 for example). This practice embraces the concept of embodied cognition data—a tactile, aesthetically engaging method of interpreting and experiencing data through the body (Gaviria, 2008).
Spend the next week (or longer) recording your chosen parameters. As shown in the file Sample data for demonstration.xlsx, each row records the date, a self-rated mood score (0–10), hours of sleep, sunlight exposure, and time spent exercising. The mood scores are self-assessed as follows:
- 0–2.5: very poor mood
- 2.5–5: low mood
- 5–7.5: decent mood
- 7.5–10: excellent mood
The data below represents a fictional week for demonstration purposes only:
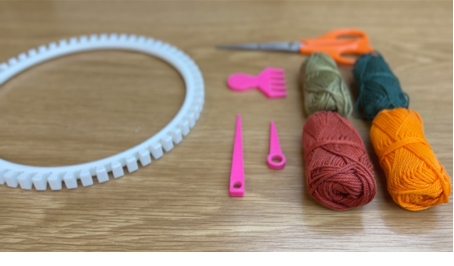
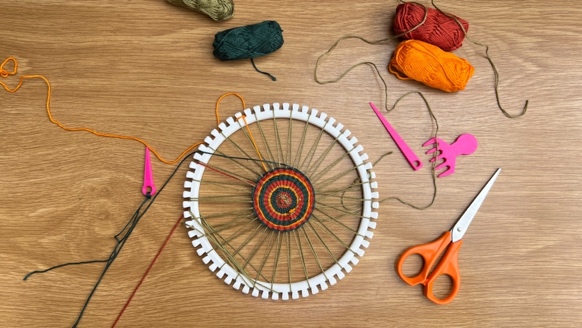
You will also need the following materials:
- A pair of scissors
- The 3D-printed Knitting Needles and Weaving Comb
- The Mini Weaving Tools
- Four colours of yarn:
- Red for mood score
- Dark green for sleep duration
- Yellow for sun exposure
- Light green for exercise duration
Translating the Data into Weaving
In this method, yarn is wrapped around the loom to physically represent the values from the data table.
Each full loop around the loom represents one unit (e.g. 1 point or 1 hour). A value of 0.5 is represented by half a loop.
For example, if the mood score on 1st March 2025 is 5, wrap the red yarn around the loom five full times.
If sleep duration is 6.5 hours, use dark green yarn to wrap six full loops and one half-loop.
Use yellow yarn to represent two full loops for 2 hours of sunlight, and light green yarn to show one loop for one hour of exercise.
Repeat this process for each day of recorded data, encoding the data visually and physically onto the weaving frame.
3.2 Weaving Data in Practice
The next portion of the project can be done by watching the video (linked below) and following the written instructions.
Video 3.2: Weaving with Data – A Step-by-Step Demonstration
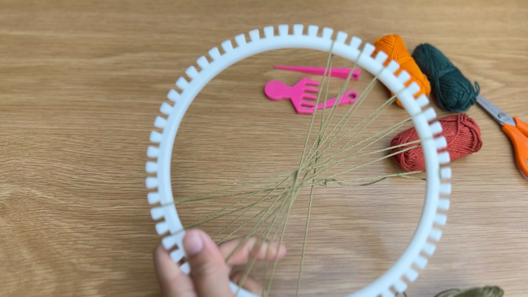
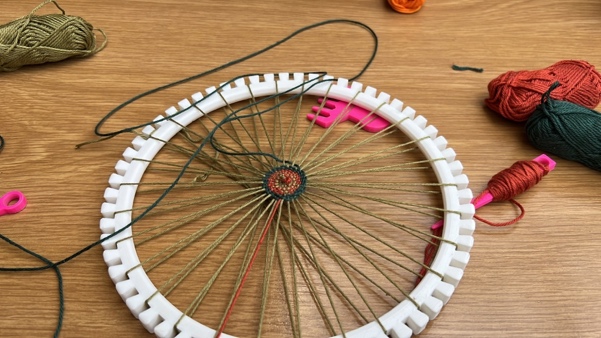
Step 1
Using the 3D-printed Mini Weaving Tools, begin by wrapping any colour yarn (this base layer forms the structural grid and will not be visible later) diagonally across each peg.
Step 2
Thread the red yarn (which represents mood scores) through the knitting needle. Tie one end securely to the centre of the base yarn to fix it in place.
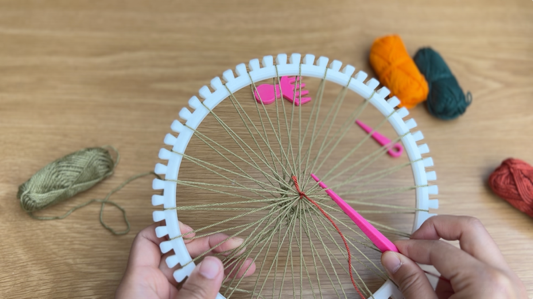
Step 3
Weave the red yarn through the warp structure in alternating intervals. Follow the data table numbers and wrap the number of full loops that match the mood score. The diagram below can be referenced for looping the yarn in and out of the base structure.
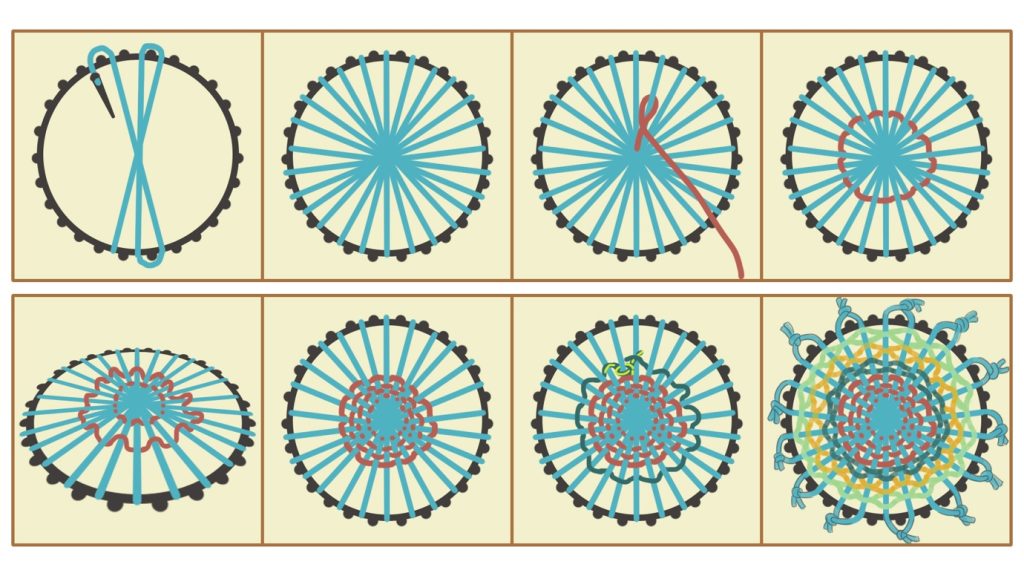
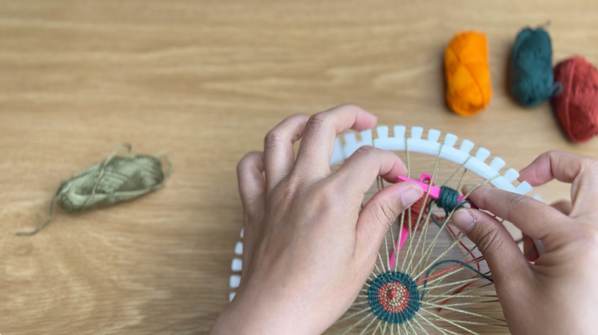
Step 4
To change yarn colours—for example, when switching from dark green (sleep) to yellow (sunlight)— simply tie the new yarn to the previous one at the point of transition.
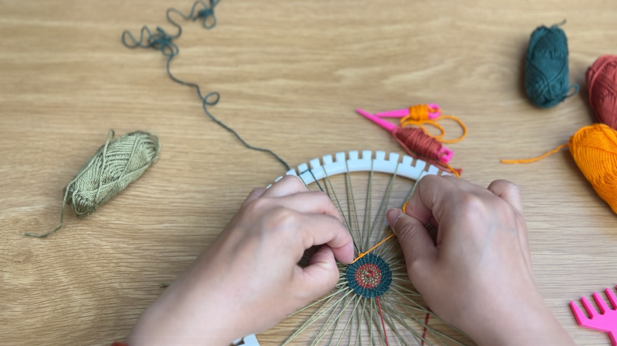
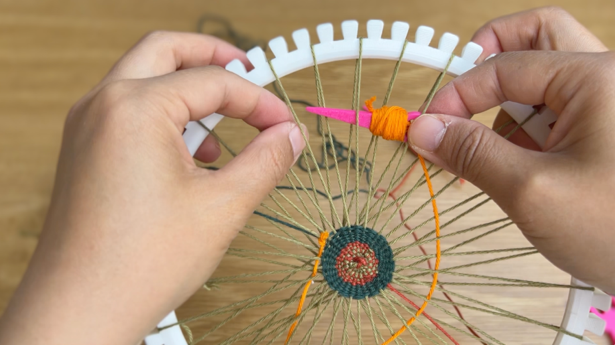
Step 5
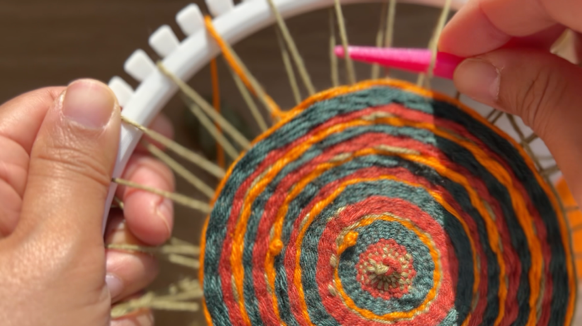
Once a day’s data is fully woven, use the comb to gently press down and shape the pattern into a regular circular form.
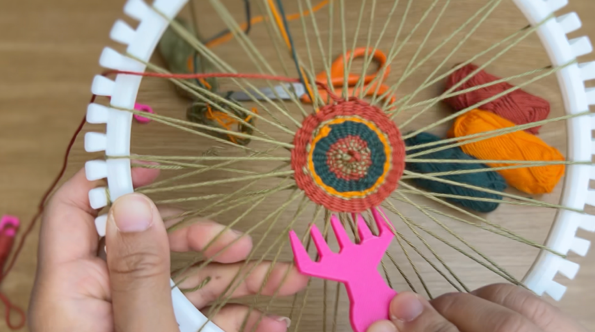
Step 6
As more rows are added, the woven pattern begins to emerge clearly, visualising the rhythms in your data.
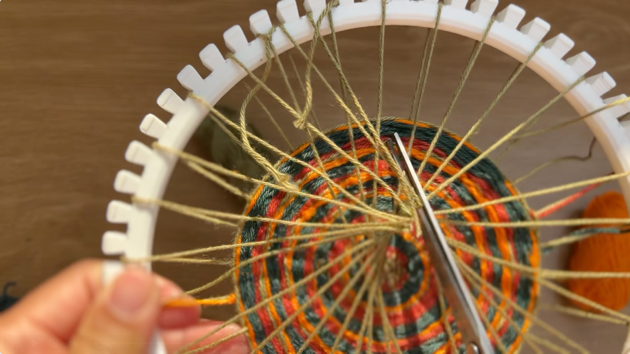
Step 7
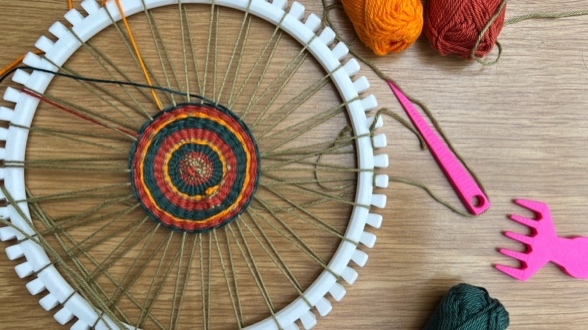
After completing the weaving of the full dataset, flip the entire loom over. Use a pair of scissors to cut the threads on the back and tie the neighbouring ends together securely along the edges of the weaving.
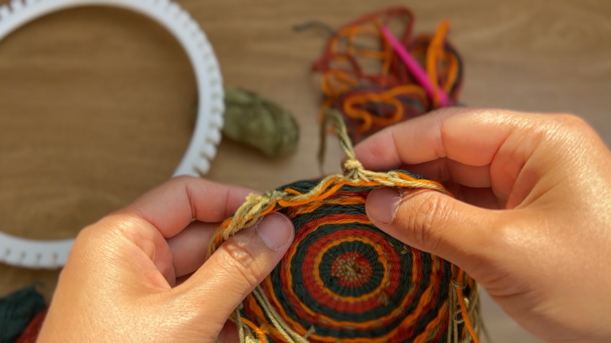
The result is a circular woven pattern that represents your mood and lifestyle data you’ve recorded for at least a week. This method can be adapted to any dataset—simply assign colours and units accordingly. For example, dark green stands for sleep: one full loop equals one hour, while half a loop equals thirty minutes.