
Chapter 4: Expansion and Innovation
YongHong Chen
4.1 Designing Alternative Weaving Patterns from Data
The woven pattern demonstrated in Chapter 3 represents one possible method for visualising data through textile form. In truth, the design potential is nearly limitless. Different types of datasets naturally give rise to different visual logics and weaving strategies.
For example, weather data (such as temperature or humidity changes) may be more suitable for gradual structures that appear wavy. The rhythm of the weaving method does not necessarily depend only on the size of the number, but can also be affected by time trends, threshold judgments, and even the user’s subjective feelings.
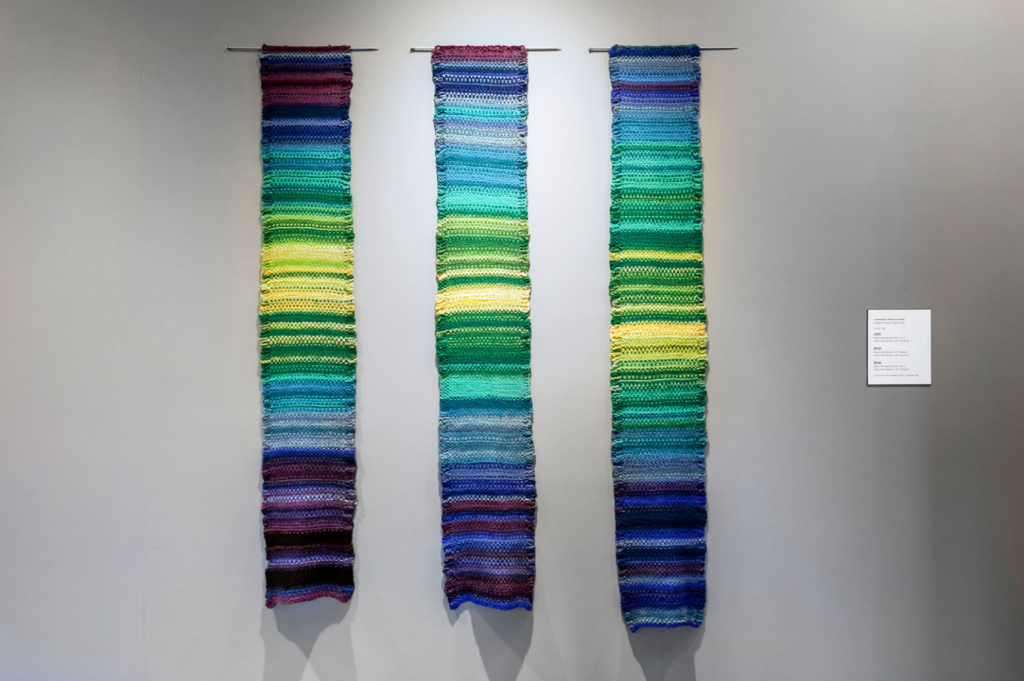
Data is both “material” and “meaningful”. Creators are free to build pattern-coding logic based on the data they choose, customising the colours, yarn types, and winding methods to fully reflect the “personality” of the data.
4.2 Refining the Loom Design
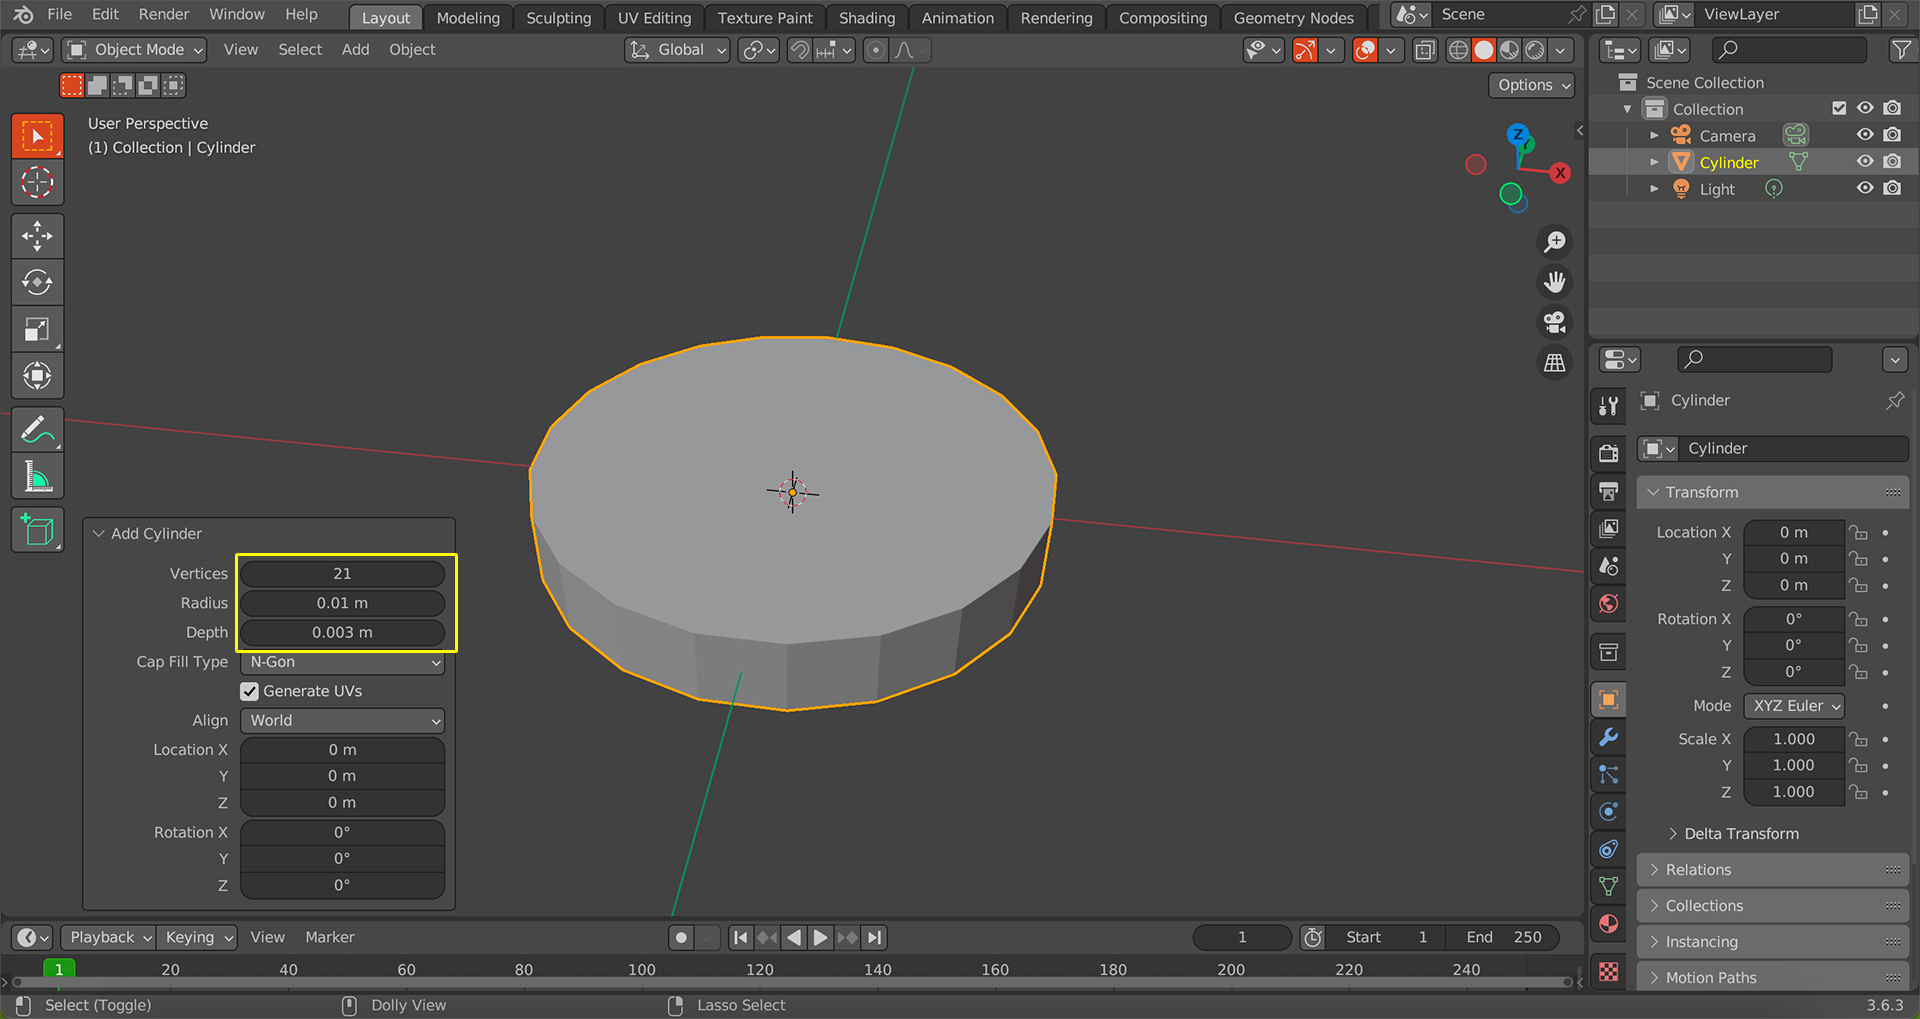
In addition to pattern innovation, improvements to the weaving tool itself are equally part of the innovation process. The mini loom currently in use has a simple design suitable for teaching and demonstration, but it can be modified in a variety of ways depending on the length of the data, the density of the weave, or the purpose of the presentation.
For example, the loom area could be enlarged to accommodate longer cycles of data. The arrangement of the pegs could also be extended from the current basic round shape to geometric, radial, or even irregular free-form patterns, allowing more flexibility in matching data to patterns.
The variability of this structure emphasises the core idea of the project: data is not static, and physical representations can embody this by changing their characteristics as the data changes.
